You're probably looking at a trace right now that seems straightforward. A few spikes, a few steps, a clean slope, maybe an event table that says everything passed. Then the link turns up hot, fails a budget check, or behaves differently from each end, and suddenly the OTDR report doesn't feel nearly as clear.
That's the gap most quick guides miss. Learning how to read OTDR test results isn't just learning what a spike or a step means. It's learning which readings on the screen are reliable, which ones are setup-dependent, and which ones need a reverse-direction test before you trust them enough to sign your name to the handoff.
Why Reading an OTDR Trace Is Harder Than It Looks
A clean trace can still hide a bad call.
On a live job, that usually shows up after everyone thinks the fiber passed. The event table looks tidy, the slope looks normal, and there is no obvious mid-span reflection. Then turn-up exposes too much loss, or a splice looks acceptable from one end and poor from the other. The problem is rarely that the OTDR failed. The problem is treating one trace as a final answer when the setup, dead zones, and test direction were already shaping the result.
The trace is only as good as the setup
Before judging any event, confirm how the test was taken. Guidance on OTDR interpretation consistently puts setup first: verify group index, wavelength, pulse width, and event classification before trusting the numbers on screen, as outlined in this OTDR interpretation guide.
That check changes more than the labels in the report. A wrong group index shifts event location. The wrong wavelength can make a bend or splice look better or worse than it really is. A pulse width that is too wide can blur two nearby events into one broad feature. At that point, the event table still prints numbers, but those numbers are tied to a test setup that may not match the link or the acceptance spec.
Launch and receive fibers matter just as much. Without them, the OTDR is partly reading its own blind area at the ends of the link, and first-connector or last-connector results deserve skepticism.
What the OTDR is really showing you
An OTDR trace is a backscatter measurement plotted over distance. It is not a direct view of the fiber.
That distinction matters in the field because the instrument is interpreting changes in returned light and converting them into location, loss, and reflectance values. Some of those values are straightforward. Some are strongly affected by the setup and by the fiber pair being tested. A reflective connector usually declares itself clearly. Splice loss often does not.
A practical reading order helps keep that straight:
Confirm the test parameters
Check wavelength, pulse width, range, averaging time, group index, and event thresholds.Verify the span length
Make sure the end of the fiber lands where the route records say it should, or close enough to justify the next step.Look at event shape before event value
A spike, a step, and a slope change point to different conditions.Decide which results need confirmation
Any splice call, short event spacing, or odd loss value near a dead zone may need a retest or a shot from the far end.
If the setup is off, the event table becomes organized guesswork.
Which readings deserve caution
Some readings are trustworthy on a single shot. A clear break, a strong reflective connector, or an obvious end reflection usually is. The more subtle calls require restraint.
Splice loss is the classic example. A one-direction trace can show apparent gain, exaggerated loss, or a nearly invisible event because the two fibers on either side do not backscatter the same way. That is why experienced crews do not sign off a questionable splice from one direction alone. They shoot it from both ends and average the result.
Dead zones also distort confidence. A connector can hide a nearby splice. A large reflection can mask what follows it. Short launch leads make this worse, and auto event detection will still try to assign values inside that area even when the trace does not support much confidence.
The settings that quietly change meaning
Factory defaults cause plenty of bad interpretations.
Crews often leave the default index in place, accept the auto pulse width, and start reading the report. That may be fine for a quick fault check on a familiar plant. It is a poor habit for acceptance work, short jumper assemblies, closely spaced events, or any link where location accuracy matters.
Use this quick setup check before trusting the trace:
| Parameter | What it controls | What can go wrong |
|---|---|---|
| Wavelength | Which fiber behavior you are measuring | Results may not match the required test condition, and bends may show differently |
| Pulse width | Resolution versus dynamic range | Nearby events can merge, or distant events can disappear into noise |
| Range | How the span is displayed and sampled | The fiber end may be clipped, or the view may be too compressed to read well |
| Averaging time | Trace noise level | A noisy trace can make small events look worse or hide them entirely |
| Group index / IOR | Distance calculation | Event locations and total length can be off enough to complicate fault finding |
| Event thresholds | What the software flags | The OTDR may miss real events or mark normal trace behavior as a fault |
Direction of measurement changes meaning too. If one end is tested through a cleaner connector set, a different launch condition, or a different fiber backscatter relationship, the same splice can read differently. That is not a contradiction. It is part of OTDR interpretation.
OTDR reading is a measurement discipline
Good OTDR work comes from treating the trace as a measurement record, not as a picture to scan for spikes.
The method has a long technical history, and later field practice and standardization built around how reflection and loss are measured on real fiber links, as summarized in this OTDR historical reference. In practical terms, that means every reading carries conditions with it. The trace can answer a lot, but only if the test setup fits the link, the dead zones are accounted for, and the technician knows which values are solid, which are directional, and which need another shot before they go on the final report.
Reading the Trace Line and the End-of-Fiber Reflection
A trace that looks clean at first glance can still mislead you. The line only makes sense if you read it with the test setup in mind, especially near the far end where noise, dead zone effects, and pulse width choices start to crowd the picture.
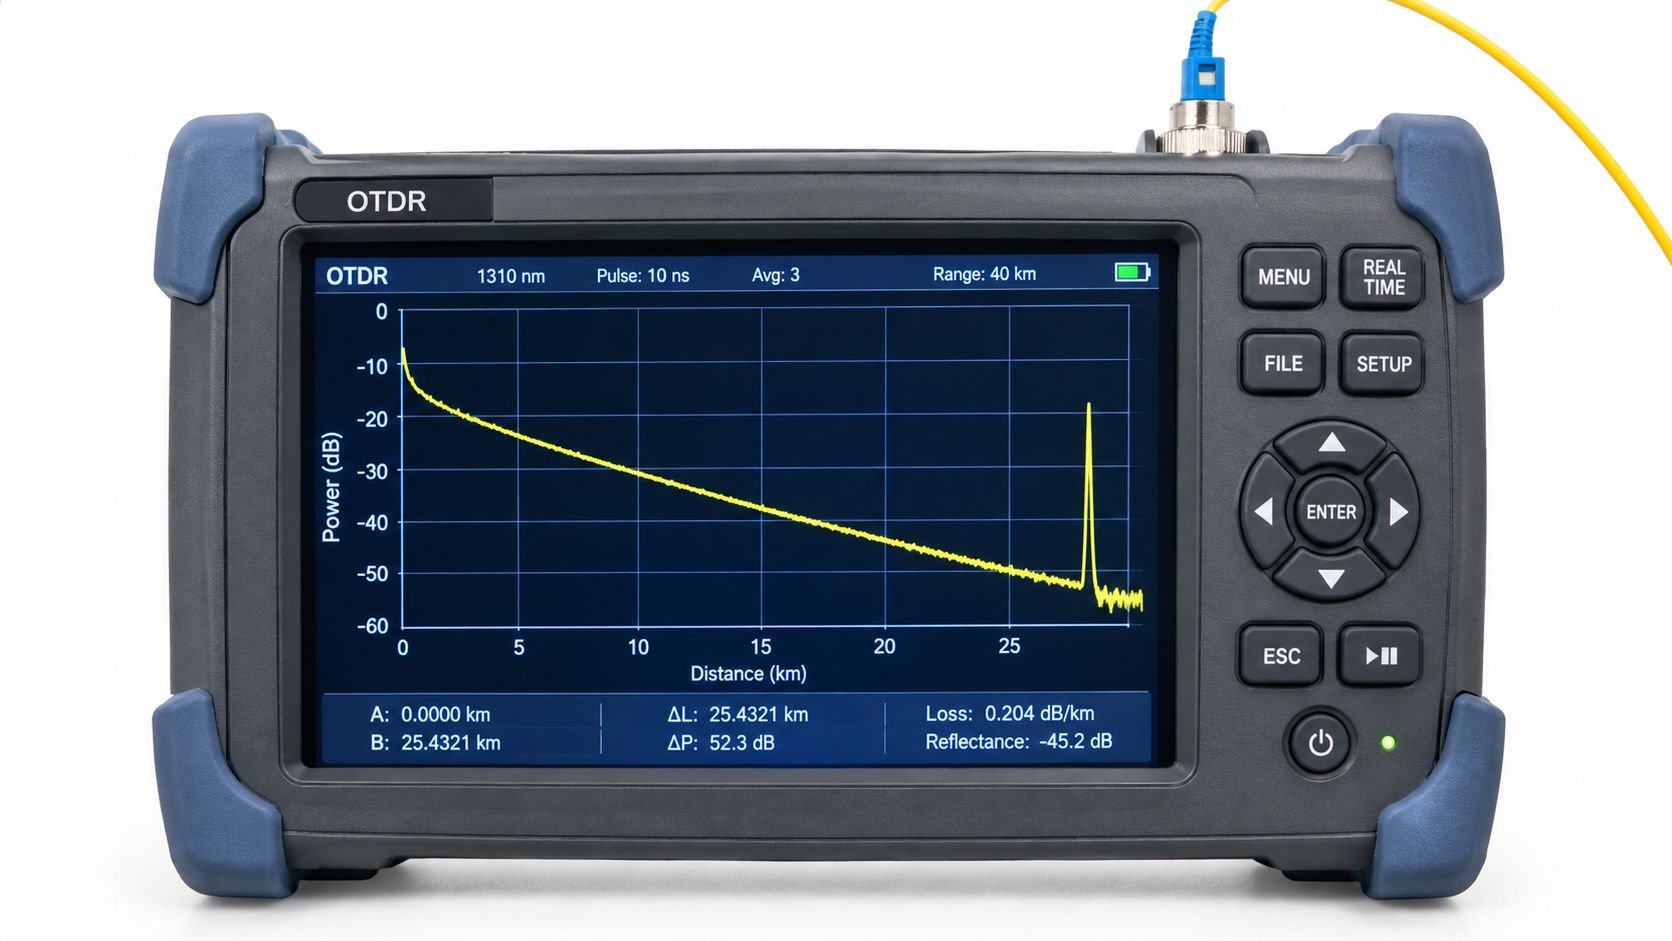
Start with the axes, then judge the line quality
The horizontal axis shows distance along the fiber. The vertical axis shows returned backscatter level in dB. As distance increases, the trace normally slopes downward because less light makes it back to the OTDR.
That part is basic. The useful part is deciding whether the slope is readable.
On a good shot, a clean fiber section trends down at a fairly even rate between events. On a poor shot, the trace gets ragged, compressed, or noisy enough that small changes stop meaning much. A slight change in slope might point to a bend, a fiber type transition, or excess attenuation. It can also come from a pulse width that is too short for the link length, a weak return near the noise floor, or a setup problem at the launch end.
Single-shot traces are strongest in the middle of a clean span. They are less trustworthy right after reflective events and near the far end of a long run.
Find the end-of-fiber reflection, but verify what you are seeing
The far-end reflection usually appears as the last large spike on the right side of the trace. On an unterminated fiber, that spike is often obvious. On a link terminated into equipment, an attenuator, or a well-mated low-reflectance connector, the end may not announce itself as clearly.
That is why I do not treat the biggest right-side spike as the fiber end until the distance also makes sense.
Set a cursor on that last major reflection and compare the location with route records, cable records, or the expected span length. If the distance is plainly wrong, stop and check the basics first. Wrong IOR, a bad launch arrangement, a ghost after a strong reflection, or the wrong fiber under test can all put a convincing-looking marker in the wrong place.
If the far end is uncertain, every event position ahead of it deserves a second look.
The shape after that last reflection matters too. A sharp drop into noise usually supports a real fiber end. Multiple echoes or repeated spikes at regular spacing suggest reflections bouncing in the link, not additional real events.
Read the line between the ends with some skepticism
Between major events, the trace line lets you judge whether attenuation looks normal for that fiber and wavelength. Use a clean segment, well away from event dead zones and away from the noisy tail at the far end.
The key trade-off is confidence versus resolution. A narrower pulse can separate close events but may leave the far-end slope too noisy to trust. A wider pulse smooths the line and reaches farther, but it can smear short sections together and hide what is happening near an event. The trace does not tell you which compromise was made. The operator has to know it from the test setup.
Direction also changes what looks normal. A section that appears slightly different when shot from the opposite end is not automatically a problem. Backscatter differences between fibers, connector condition, and launch conditions can shift the apparent loss profile enough to change your first impression of the line.
A short visual walkthrough helps if you want to watch the process on a screen before doing it in the field.
Identifying Reflective and Non-Reflective Events on the Trace
Most OTDR mistakes happen at the event level. The operator sees a spike, labels it a connector, sees a step, labels it a splice, and moves on. In the field, that shortcut causes trouble because event shape is affected by pulse width, dead zones, and which end you shot from.
Spikes mean one thing, steps mean another
A reflective event usually shows an upward spike. A non-reflective event usually shows a step down with no spike. That basic rule is sound, and this OTDR trace interpretation reference lays out the standard pattern.
The problem is that real traces are rarely that clean. A connector can reflect and lose power at the same time, so you get a spike with a step after it. A bend can look like a splice on one setup and almost disappear on another. Two close events can blur into one shape if the pulse is too wide or the event dead zone has not fully recovered.
That is why event identification is not just shape matching. It is shape plus setup.
Read left to right, but question what the setup may be hiding
Work through the trace one event at a time and classify what you see, not what the event table guessed.
- Sharp upward spike: Common at connectors, mechanical splices, breaks, and open fiber ends.
- Clean downward step with no spike: Common at fusion splices, bends, and other non-reflective loss points.
- Spike followed by a downward step: Common at a connector with both reflectance and insertion loss.
- Wide, smeared, or uneven event shape: Often means unresolved close events, dead-zone recovery, or a pulse-width choice that favored range over separation.
A single-shot trace can suggest the event type. It does not always settle it.
I trust a clean isolated spike more than a messy near-end event sitting inside recovery. I trust a neat step in a quiet part of the trace more than a tiny loss call right after a strong reflector. That is the practical difference between reading the screen and understanding what the instrument had a fair chance to resolve.
Field note: Auto-event markers save time, but the trace shape gets the final vote.
Direction of test can change the story
A reflective connector usually looks reflective from either end. The apparent loss tied to that same connector may not agree nearly as well.
Backscatter mismatch between fibers can make one splice look worse from one direction and better from the other. A bend may stand out more at one wavelength or from one end depending on where it sits in the link and how much noise is building at that distance. A near-end event can also look cleaner from the opposite direction because it is no longer buried in the launch-side dead zone.
If an event is close to the limit, a bidirectional check is usually worth the time. One-direction OTDR results are good at finding suspects. They are less reliable for judging marginal events in a final acceptance decision.
Don't let software overrule what the trace shows
Modern OTDR software does useful first-pass sorting, but it still merges, mislabels, and overcalls events. On a long shot with a wide pulse, two nearby connectors may show up as one blended event. On a noisy tail, the instrument may mark small fluctuations that do not hold up on a retest. Near the launch end, unresolved recovery can get tagged as a splice or minor connector loss when the trace does not support that conclusion.
Use the event table as a worksheet. Use the trace as evidence.
| Trace shape | Likely physical cause | Typical concern level |
|---|---|---|
| Upward spike | Connector, break, open end, reflective mechanical interface | Moderate to high, depends on location and reflectance |
| Step-down with no spike | Fusion splice, macrobend, microbend, non-reflective loss point | Low to high, depends on loss magnitude and pattern |
| Spike plus step-down | Connector with insertion loss, contaminated or damaged interface | High if loss or reflectance is poor |
| Gradual slope change | Fiber attenuation change, bend-sensitive section, fiber transition | Medium, usually needs contextual review |
| Blended or smeared event | Events too close together, pulse too wide, dead-zone recovery | High uncertainty, retest recommended |
Measuring Event Loss and Reflectance From the Trace
A connector can show a clean-looking spike and still fail acceptance. A splice can show almost no visible disturbance and still deserve a second test. The number in the event table only helps if the trace conditions support it.
Event loss and reflectance both come from a comparison the OTDR makes around the event. It looks at the backscatter level before the event, the recovery after it, and, for reflective events, the height of the returned peak. That sounds straightforward until the setup starts distorting the picture. Marker placement, nearby reflections, fiber mismatch, and noise on the far end all change how believable that calculated number is.
What the two key measurements mean
Event loss is the change in the trace level caused by the event. On a good, isolated event, that gives a workable estimate of insertion loss.
Reflectance is how much light is sent back toward the OTDR by that event. It is reported in negative dB. A more negative value means less reflected light, which is usually the better result for connectors and other reflective interfaces.
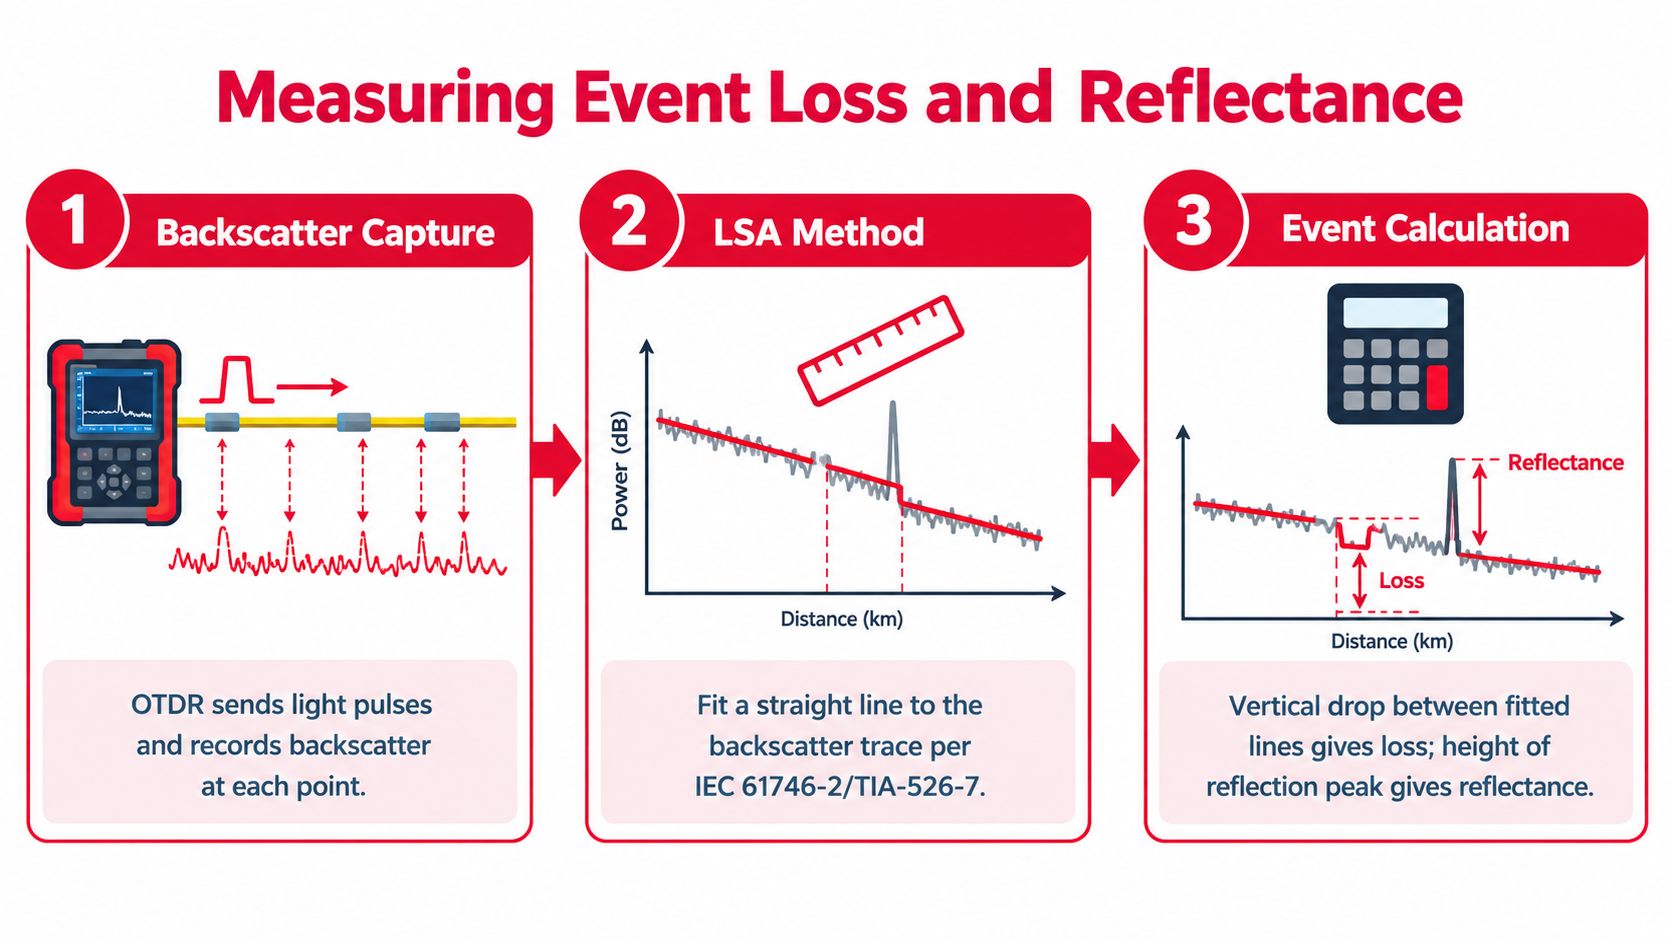
Those definitions are the easy part. The harder part is knowing when the OTDR had enough clean trace on both sides of the event to measure it properly.
What good field values usually look like
In field acceptance work, connectors are often expected to stay in the low tenths of a dB, fusion splices are expected to be much lower, and reflective events should show suitably low reflectance for the connector style in use. APC connectors usually reflect less than UPC connectors when they are clean and mated correctly.
Use those ranges as screening values, not as gospel from a single trace. If a connector suddenly shows unusually poor reflectance, the first suspects are usually contamination, ferrule damage, poor seating, or the wrong polish type at the interface. If the loss number is high but the trace is crowded or noisy, retest before calling the link bad.
Where the event table misleads people
The OTDR does not measure event loss the same way a loss test set does. It infers loss from backscatter. That matters any time the fiber on one side of the event does not scatter light the same way as the fiber on the other side.
A splice between dissimilar fiber sections can read better than it really is in one direction and worse in the other. In the field, that is the classic reason for an apparent gainer. The splice did not add power. The OTDR is seeing a backscatter coefficient change and turning that into a misleading step height.
Three checks keep you out of trouble:
- Look at the baseline before and after the event. If either side is sloped by recovery, noise, or a nearby reflection, the computed loss can be off.
- Treat closely spaced events with caution. A connector and splice packed too tightly can blend into one event, and the reported loss may belong to neither one cleanly.
- Question any surprising result that appears in only one direction. If the event is near a limit or shows gain-like behavior, a bidirectional average is the safer number for splice judgment.
On a clean mid-span splice with stable trace levels, I will usually trust the OTDR's estimate enough to sort good work from bad work. On a near-end event, a crowded patch panel, or a transition between unlike fibers, I treat the printed value as a clue and verify it with another setup or the opposite direction.
That is the discipline here. Read the number, then decide whether the trace earned your trust.
Dead Zones, Launch Cables, and Pulse Width Choices
You test a short link from one end, and the first connector shows up right away. The trace makes it look measured. In practice, that first event is often only visible, not trustworthy.
That distinction matters more than many reports admit.
A strong near-end reflection can overload the receiver for a short distance after the event. The OTDR may draw a trace and even place an event marker, but the loss and reflectance values inside that recovery region can be shaky. On a single-shot test, that is where crews accept a bad first connector or reject a good one for the wrong reason.
Two dead zones, two different limits
OTDR manuals separate dead zones into two categories for good reason. Event dead zone is the spacing required to distinguish one reflective event from the next. Attenuation dead zone is the longer spacing required before the OTDR can measure the loss of a following event with acceptable accuracy, as defined in this OTDR theory workshop reference.
Those are two different limits on interpretation. If an event falls inside the event dead zone, you may not resolve it cleanly at all. If it falls outside the event dead zone but inside the attenuation dead zone, you may see it and still not have a reliable loss number.
That is why a trace can look readable and still be misleading.
Pulse width changes the story the trace is able to tell
Pulse width is one of the biggest reasons the same fiber can produce two very different-looking traces.
A short pulse gives better resolution. It helps separate close connectors, short pigtails, and crowded panel events near the front end of the link. The trade-off is lower dynamic range, so on longer spans the back end may disappear into noise or become too weak for confident event analysis.
A long pulse reaches farther and improves visibility on higher-loss or longer links. It also broadens reflections, lengthens recovery, and blends nearby events together. If the first few events are close, a long pulse can turn several real features into one oversized reflective shape with numbers that look precise and are not.
In field work, I do not trust one pulse width to answer every question. I use the shortest pulse that still reaches the portion of the link I need to judge, then retest with another width if the trace shape suggests crowding or recovery effects.
Launch and receive cables change what you can measure
Without a launch cable, the OTDR is trying to judge the first connector while it is still recovering from its own front-end reflection. That setup is fine for rough fault location. It is weak for acceptance work on the near-end connection.
The same problem exists at the far end. Without a receive cable, the last connector sits at the end-of-fiber region, where the terminal reflection and fiber end can distort the event reading. Guidance from the FOA installation reference supports using launch and receive cables when those end connections need to be measured, not just located, as reinforced in the FOA installation standard reference.
Cable length matters too. A launch cable that is too short does not move the first link event far enough past the dead zone. You still get a trace. You just do not get a measurement I would sign off on without a second look.
What usually works in the field
- Use the shortest pulse that still gives a clean view of the span you are judging.
- Add a launch cable before trusting the first connector's loss or reflectance.
- Add a receive cable if the last connector is part of the acceptance decision.
- Retest from the opposite end when a near-end event is close to the limit or packed against another event.
- Treat auto-analysis with caution around strong reflections, short jumpers, and crowded patch panels.
Direction matters here more than many beginners expect. An event buried in the launch-side dead zone from one direction may be clean and measurable from the far end. That is one reason bidirectional testing is not just about averaging splice loss. It also exposes which readings were setup-limited in the first place.
| Pulse width | Event separation | Loss accuracy near reflections | Reach | Best use |
|---|---|---|---|---|
| Short | Better | Better | Lower | Short links, patch panels, near-end event analysis |
| Medium | Moderate | Moderate | Moderate | Mixed links where both reach and resolution matter |
| Long | Worse | Worse near crowded events | Better | Longer spans and far-end fault location |
A clean trace is not automatically a trustworthy trace. If dead zones, launch setup, or pulse width are working against you, the OTDR can print a number before it has earned it.
Acceptance Thresholds and Link Pass or Fail Decisions
A pass decision starts before the first event table value. It starts with the spec you are being held to, the test method the project accepts, and whether this particular trace was set up well enough to support a call.
Field benchmarks still help as a rough screen. Many crews expect low splice loss, reasonable connector loss, and reflectance that does not point to a dirty or damaged connection. But job acceptance is not based on rough screen numbers if the contract, customer, or standard says otherwise. Use the project limits first. Use the OTDR trace to judge whether the reported values are believable.
That last part matters more than many reports admit.
A connector can show a passing loss number and still deserve a fail review if the reflectance is poor, the baseline is unstable, or the event sits too close to another feature for clean marker placement. A splice can look high from one end and normal from the other because of backscatter mismatch, not because the splice was bad. On a single-shot test, those are not small details. They change whether the number means anything.
Use thresholds with the setup in mind
Acceptance should compare four things:
- connector event loss against the project limit
- splice event loss against the project limit
- reflectance where the spec requires it
- fiber section attenuation against the expected fiber type and wavelength
Then make one more check. Ask whether the setup supports those measurements with enough confidence to sign off.
If the first connector was tested without a proper launch, I would not accept that event loss as final. If the last connector has no receive fiber, I would not use that end reading to settle an argument. If a near-limit event was measured with a long pulse through a crowded panel, I would treat the number as provisional until the trace is rerun under tighter conditions.
OTDR alone usually shouldn't close the job
Many installed-fiber acceptance packages still rely on insertion loss testing as the primary pass or fail method, with OTDR used to locate, characterize, and document events. That is good practice, not paperwork trivia.
OTDR is strongest when the question is location. Where is the bad splice. Which connector is reflecting. Is the loss concentrated in one event or spread across the route. It is less reliable as the only closeout tool when the link is short, event spacing is tight, or the measurement direction favors one side of the story.
Use the method the project requires. If the OTDR result and the accepted certification method disagree, stop and resolve the conflict before handoff.
Margin calls need engineering judgment
The hardest calls are the traces that barely pass on paper.
A connector just under the loss limit with ugly reflectance deserves inspection and cleaning, then a retest. A splice that passes from one direction and misses from the other deserves bidirectional review before anyone averages or dismisses it. A total link loss that passes while one event is clearly abnormal still needs attention, because acceptance is usually about both the whole link and the individual events that make it up.
A practical workflow looks like this:
Confirm the report metadata
Check wavelength, pulse width, range, refractive index, launch and receive setup, and file naming.Judge whether each event was measurable
Review baseline quality, event spacing, and whether dead-zone limits or reflection tails affected the markers.Separate clear passes from conditional passes
A clear pass came from a clean setup and a stable trace. A conditional pass needs retest, reverse-direction confirmation, or another approved test method.Document exceptions before closeout
If you accept a marginal event based on bidirectional results, engineering review, or project tolerance, record why.
For crews managing construction closeout and documentation, providers such as Southern Tier Resources handle fiber splicing, testing, and documentation as part of broader telecom infrastructure delivery, which is directly relevant when OTDR results need to hold up during customer handoff and acceptance review.
| Parameter | Single-Mode (OS2) | Multimode (OM3/OM4) |
|---|---|---|
| Connector loss | Verify against the project limit and test method | Verify against the project limit and test method |
| Fusion splice loss | Verify against the project limit and bidirectional review where required | Verify against the project limit and test method |
| Reflectance | Check where the spec requires it, especially at connector events | Often less central to acceptance, but review if the project calls for it |
| Section attenuation | Compare with expected attenuation for the fiber and wavelength used | Compare with expected attenuation for the fiber and wavelength used |
Reading Real OTDR Traces From the Field
A crew finishes a span, the trace looks clean, and the event table shows a pass. Then the customer reviews the files, tests from the far end, and one splice suddenly looks worse. That happens because a field trace is not just a picture of the fiber. It is also a picture of the setup, the pulse, the dead zones, and the direction you shot from.
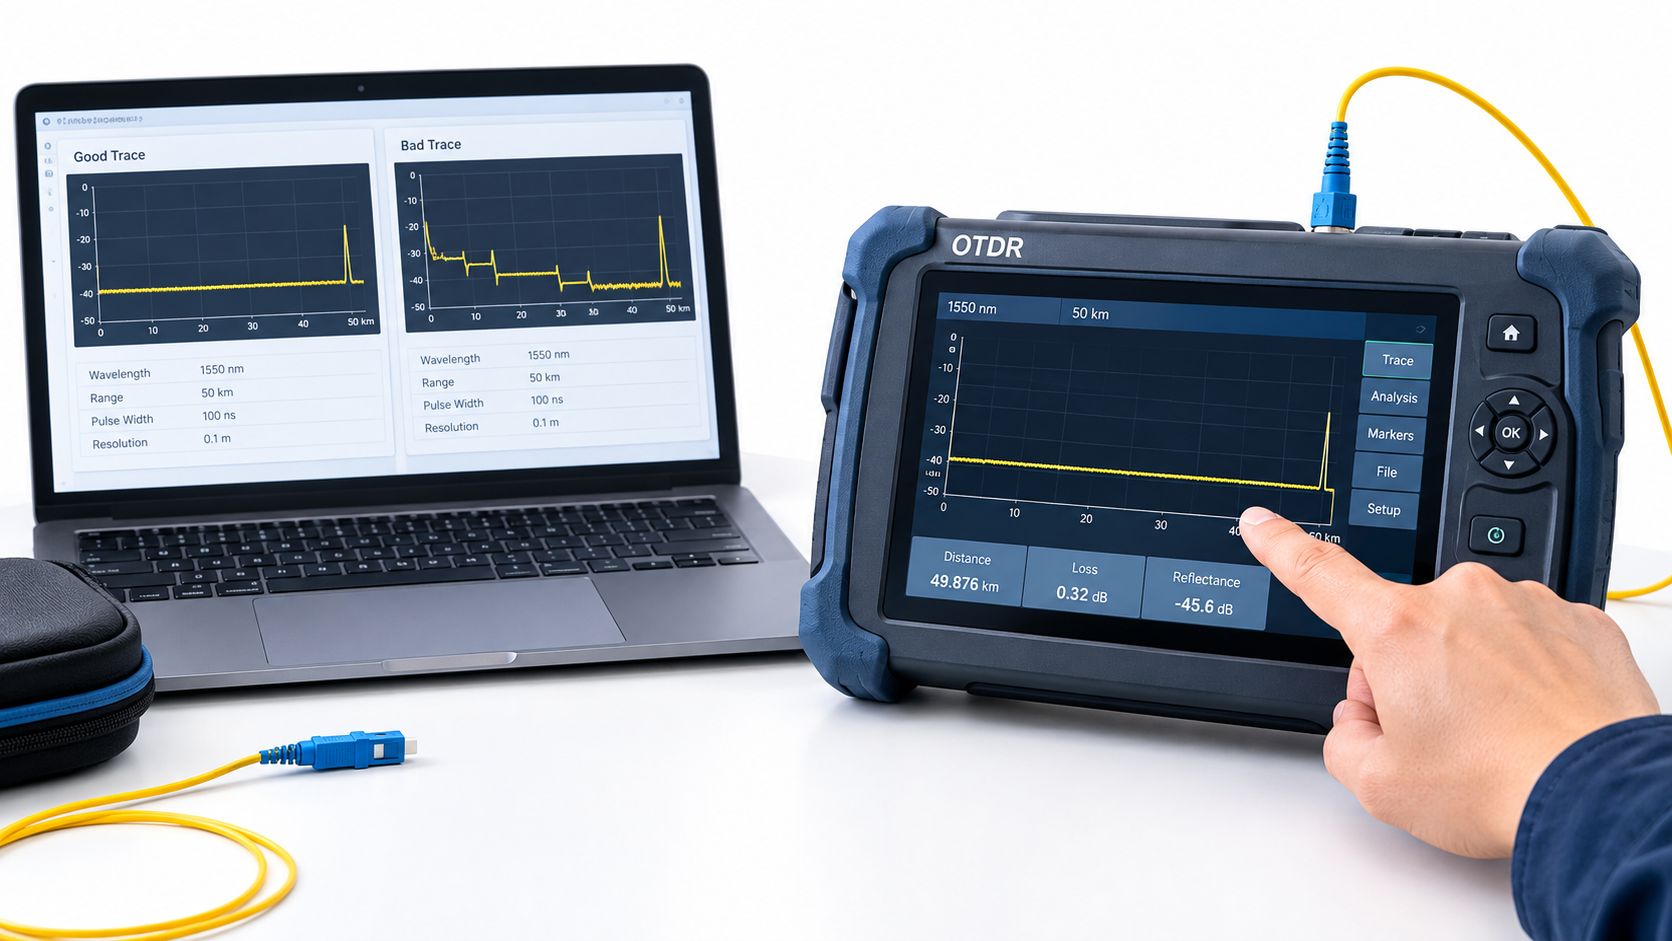
A clean trace can still hide a bad call
The easiest traces to misread are the pretty ones.
You get a smooth backscatter slope, a normal-looking end reflection, and no ugly mid-span spikes. On paper, that run looks easy to approve. Then one event sits a little off trend. The loss is small enough to avoid an alarm, but the shape is wrong, or the baseline on one side does not match what the rest of the route is doing.
That is usually where auto analysis starts to mislead people. A single-shot trace can understate a splice if nearby reflections, pulse width, or backscatter mismatch flatten the step. It can also make a harmless transition look suspicious. Before accepting that event, move the markers by hand and check whether you have room to measure it cleanly. If the event sits too close to a connector tail or inside a dead zone, the displayed number may not mean much.
I trust a clean setup before I trust a clean-looking trace.
Ugly traces are not always bad fiber
Short links, busy patching, older jumpers, and field conditions can produce traces that look rough even when the link is serviceable. The mistake is treating every wiggle as a defect.
Real events repeat in a believable location and have a shape that fits the hardware. Noise does not. If a non-reflective step appears once, returns to the same slope, and lines up with a known splice point, that is usually more credible than three software-called events scattered through a noisy section. On the other hand, if the trace is so unsettled that marker placement changes the result too much, the right answer is not to argue over tenths. The right answer is to retest with a better setup.
That judgment matters in the field. Some traces can support a pass decision on the first shot. Some cannot.
What changes the meaning of the trace
The same physical link can read differently for good reasons.
A splice tested from one end may look better or worse because the fibers on each side scatter differently. A connector near the OTDR may appear measurable in the event table, but without a proper launch cable it is still sitting in the instrument's blind region. A short pulse may separate tight events but make the far end noisy. A longer pulse may clean up the backscatter line while burying two close events into one broad feature.
Those are not edge cases. They are routine field trade-offs. If a reading depends heavily on pulse width, marker placement, or test direction, treat it as provisional until a second trace confirms it.
Problems that keep showing up in closeout packages
The repeat offenders are easy to recognize:
Accepting the first event without enough launch fiber
The OTDR may assign a connector loss value, but if the near-end event is inside the dead zone, that value is not dependable.Approving a splice from one direction when the shape is questionable
A one-way result can be fine for screening. It is weak support for a disputed splice.Calling reflection tails separate events
Some traces show shoulders, ghosts, or broad recoveries that look like extra faults to anyone reading too fast.Using a pulse width that cleans up the trace at the cost of resolution
A smoother line is not automatically a better measurement.Saving files that cannot be tied back to route, fiber, and direction
A valid trace with weak documentation still creates handoff trouble.
A fast field review before you close the job
Before final save and upload, check a few things that catch most bad assumptions:
- Confirm the test direction matches the file name and route record.
- Confirm the wavelength and range match the job requirement.
- Check whether the first and last events were measurable with the launch and receive setup used.
- Scan the event table against the trace shape for obvious miscalls.
- Revisit any event that changes noticeably when markers move or pulse width changes.
- Compare opposite-direction traces on any splice that looks better than the surrounding work suggests.
- Make sure the end-of-fiber signature is real and not a range or setup problem.
That last point matters more than many crews admit. I have seen links reported short because the range clipped the tail, and I have seen links reported long because a reflection artifact was mistaken for the end.
A good field read is not just spotting spikes and steps. It is knowing which numbers came from a sound setup, which ones were shaped by dead zones, and which ones need the opposite direction before anyone should sign off.
Southern Tier Resources supports fiber projects that depend on clean acceptance testing, solid documentation, and field decisions that hold up after turn-up. If your team needs help with fiber splicing, OTDR testing, construction closeout, or network maintenance, visit Southern Tier Resources to see how they fit into that workflow.