Cell tower capacity isn't a fixed per-site number, it shifts with spectrum, radio configuration, antenna sectorization, backhaul, device mix, and where demand lands at a given hour. A network can have spare capacity overall and still fail badly at a stadium gate, a highway interchange, or a dense residential pocket.
That's why the right question isn't “How much can a tower carry?” It's “What's the bottleneck in this place, at this time, on this layer?”
Why Cell Tower Capacity Is Not a Fixed Number

A tower's usable capacity depends on where demand concentrates and when it arrives. Two sites with similar equipment can perform very differently in the field. I've seen a site with ample headroom on paper choke during a concert entry window, while a nearby rural macro remained underused most of the day because traffic never gathered there.
Distribution, not just density, decides the outcome
The common failure mode is uneven loading. A site can look healthy in aggregate while one sector carries a crowded venue, residential block, or interchange and another sector remains lightly used. An analysis of 1,818 towers across three countries found 20% of geographic clusters were over-utilized congestion hotspots, while 122 towers were strictly under-utilized. That finding points toward placement and optimization as well as additional construction (analysis of 1,818 towers).
The same pattern appears in different demand profiles. A stadium pushes thousands of devices into a few sectors within minutes. A factory compresses traffic around shift changes. A residential cluster produces a predictable evening surge. Average site utilization can remain acceptable while users in the busiest area experience congestion.
Practical rule: complaints concentrated in one location or time window should send engineers to the sector map first. Review the traffic profile, busy-hour loading, and interference picture to identify where the problem actually lives.
The remedy follows the constraint. More spectrum or cleaner reuse can help when radio resources are saturated. Sectorization may be better when an antenna footprint covers too many users. A small-cell layer can place capacity closer to a venue or dense block, while a backhaul upgrade addresses transport limits. Also check whether the busiest users are clustered on the same layer or carrier.
Why “more towers” is often the wrong reflex
At a concert entrance, adding a macro several streets away may leave the gate-area sectors overloaded. Splitting the sector, adjusting the antenna pattern, or placing a small cell near the queue can move capacity to the people generating the demand. A new macro site still has a role when the surrounding area lacks coverage or radio resources, but it should follow evidence from time-and-location-specific KPIs.
The useful planning question is which intervention relieves the constrained sector with the least disruption, rather than how many towers the map contains. That is the practical meaning of a distribution problem.
Understanding Cell Tower Capacity and Core Metrics
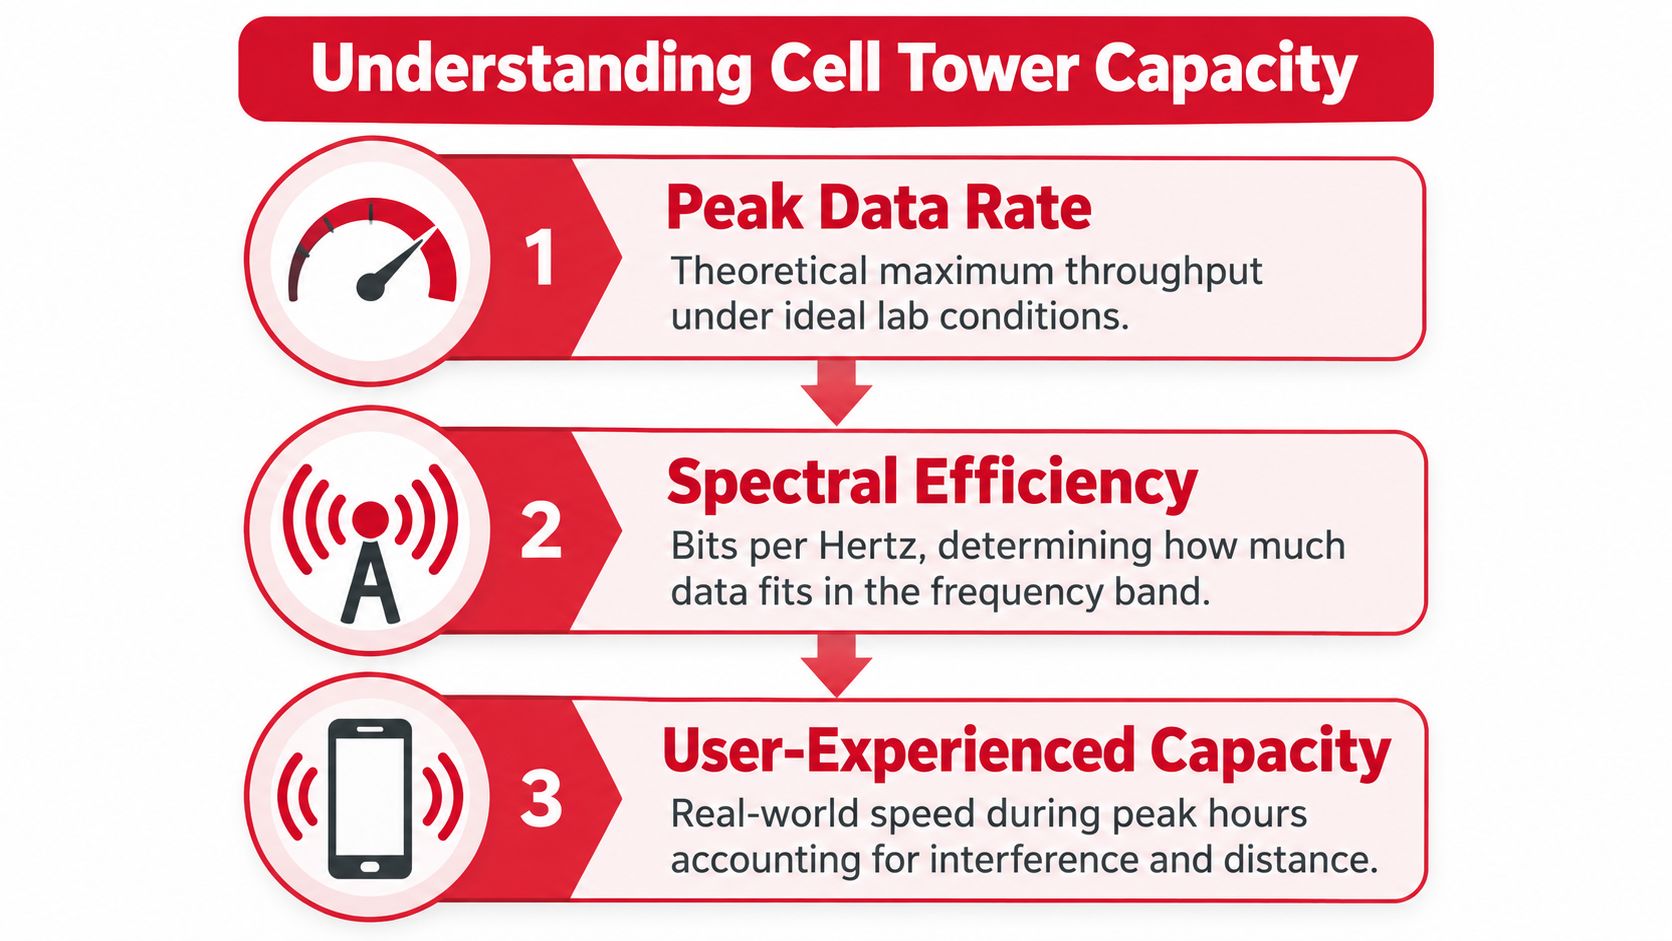
The cleanlest way to think about cell tower capacity is simple. It is the amount of traffic a site can carry at acceptable quality after you account for spectrum width, spectral efficiency, overhead, interference, scheduling, and propagation conditions. Peak rate is not the same thing as usable capacity, and that distinction matters more in a loaded network than in a lab.
Peak specs don't tell you what the sector can carry
For 5G NR, the IMT-2020 technical requirement is a peak downlink spectral efficiency of 30 bit/s/Hz and uplink spectral efficiency of 15 bit/s/Hz under idealized conditions, which are peak single-user engineering benchmarks, not expected sector throughput (ITU IMT-2020 requirement). A carrier can advertise impressive peak performance and still run into congestion when multiple users compete for the same time-frequency resources.
That's why planning teams look at busy-hour traffic, cell-edge throughput, and resource-block occupancy instead of leaning on marketing-grade speed claims. A high peak rate can coexist with poor user experience if the cell edge is weak, interference is high, or the scheduler is serving too many active sessions at once.
Practical rule: if peak speed is high but real users still complain, the site is usually constrained by sharing, not by headline modulation capability.
The core formula is straightforward in principle. Spectral efficiency times usable channel bandwidth gives you the starting point, then overhead, retransmissions, mobility margins, TDD partitioning, and multi-user scheduling reduce what customers see. That's why a strong lab figure doesn't map cleanly to the field.
Capacity KPIs and What They Tell You
| KPI | What It Measures | Planning Use Case |
|---|---|---|
| Spectral efficiency | Bits delivered per hertz | Compare radio efficiency across bands and configurations |
| Busy-hour traffic | Load during the worst practical window | Size the sector for peak demand, not daily average |
| Cell-edge throughput | Performance for weak-signal users | Validate whether edge users can still run real applications |
| Resource-block occupancy | How much scheduling capacity is consumed | Spot congestion before customers complain |
| Latency under load | Delay during contention | Check whether the site still supports interactive traffic |
The most useful KPI is the one that matches the complaint. If the issue is slow video at a stadium, peak rate is the wrong metric. If the issue is poor phone service at the edge of coverage, cell-edge throughput and latency matter more. If the issue is a network that looks fine until prime time, resource-block occupancy usually gives the first honest warning.
Technical and Operational Limiting Factors
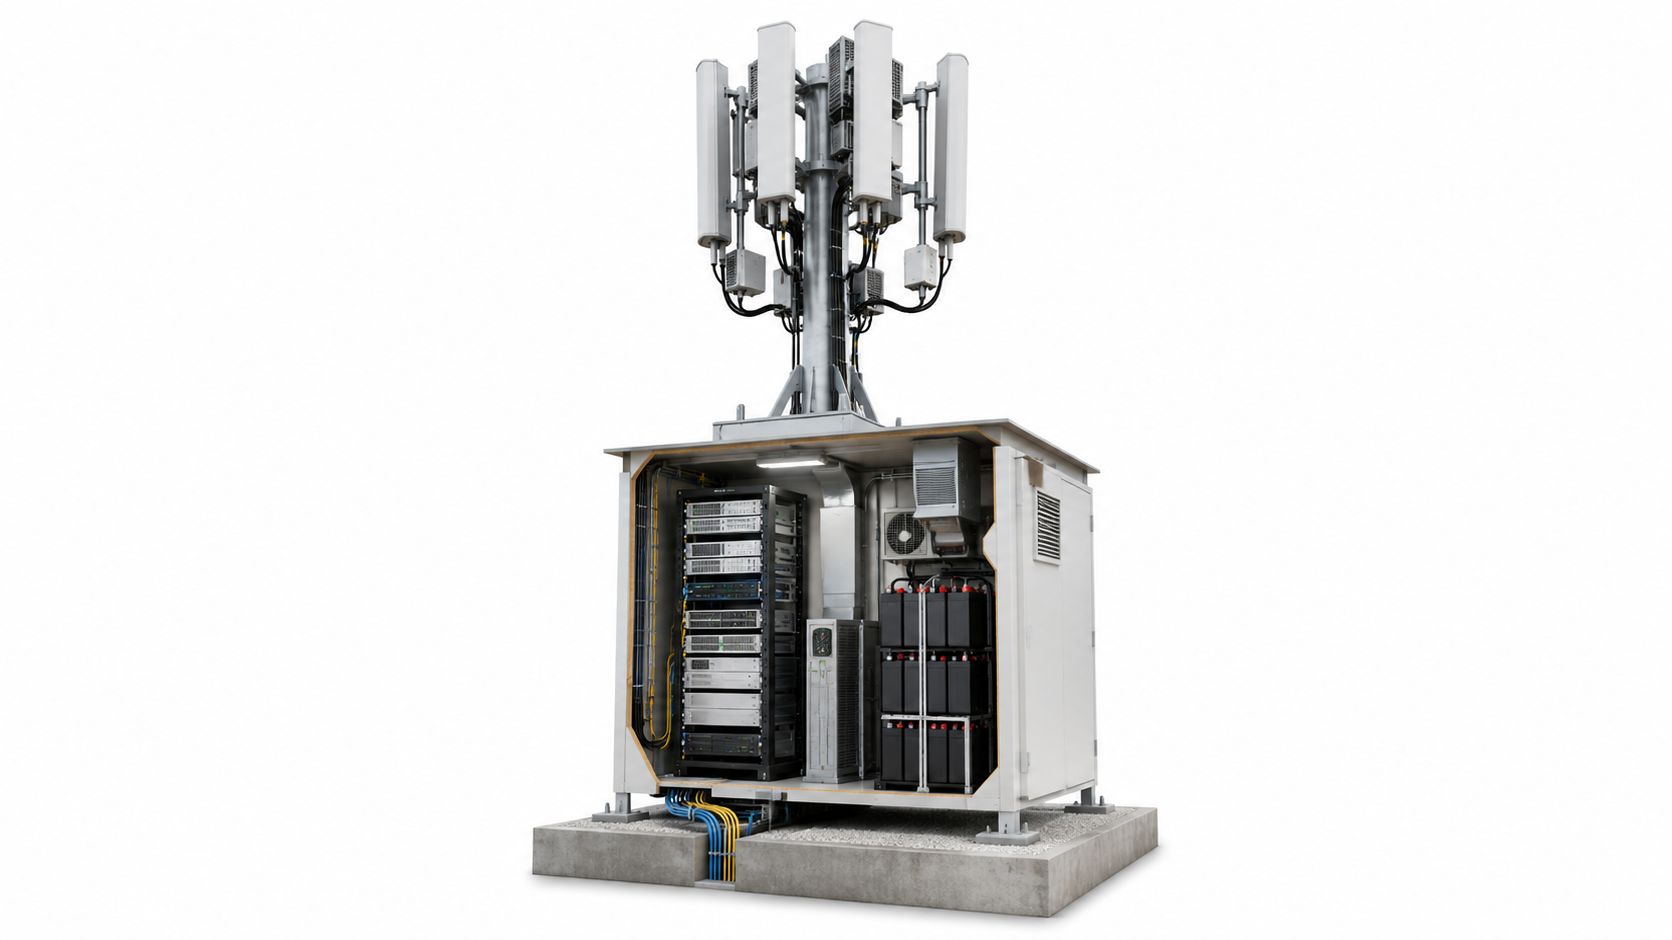
Capacity fails for boring reasons before it fails for dramatic ones. A sector can be radio-ready and still underperform because backhaul is thin, power is constrained, cooling is inadequate, or the antenna pattern is pushing energy into the wrong part of the footprint. The site looks fine in a coverage map, but the actual operating conditions are fighting the design.
One upgrade rarely fixes a multi-layer bottleneck
Adding spectrum or carrier aggregation only helps when the rest of the stack can support it. If the radio can't process the added layer, the backhaul can't move the traffic, or interference is already too high, the extra capacity never becomes usable. That's why tower work has to be treated as a system problem, not a parts swap.
TDD partitioning is a good example. A site can have plenty of bandwidth on paper and still underdeliver if the downlink and uplink split doesn't match the live traffic mix. Device mix matters too, because not every handset, router, or fixed wireless unit behaves the same way under load.
Here's the practical sequence I use when diagnosing a saturated sector:
- Check the traffic pattern first. If congestion is localized, the site may need steering, sector split, or densification rather than wholesale rebuilding.
- Check interference next. Poor SINR raises resource usage for the same delivered bit, which lowers capacity for everyone.
- Check backhaul and power. If either is tight, radio-side improvements won't stick.
- Check antenna geometry. Azimuth, tilt, and sectorization often determine whether new capacity lands where the users are.
- Check device behavior. A few heavy consumers, especially fixed wireless subscriptions, can reshape a site's load profile fast.
Coverage can hide a capacity problem
Coverage and capacity aren't the same thing. A network can reach a place cleanly and still fail to serve it at peak times. That's why the right diagnostics are time-and-location-specific, not averaged across a day or generalized from a map.
The operational lesson is direct. If you don't know whether you're dealing with spectrum shortage, backhaul shortage, or a traffic-distribution problem, you can spend money in the wrong place and still miss the bottleneck.
Capacity Strategies and Trade-offs by Scenario
Different congestion patterns call for different remedies. A stadium doesn't behave like a rural highway corridor, and an apartment-heavy fixed wireless pocket doesn't behave like an office district. The best capacity plan is the one that matches the site shape, the load shape, and the backhaul shape.
Pick the intervention that matches the bottleneck
Recent analysis identified FWA, new device categories such as AR glasses, and multimodal generative-AI applications as important sources of future traffic, while noting that additional mid- and centimetric-band spectrum may be needed for rising uplink demand (Ericsson mobility report June 2025). That matters because the right fix for a heavy residential FWA footprint is not always the same fix for a crowded public venue.
Practical rule: if the demand is dense and localized, bring capacity closer to the user. If the demand is broad but the sector is weak, improve the macro layer first.
Capacity Strategies Compared
| Strategy | Best For | Complexity | Speed to Relief |
|---|---|---|---|
| Macro upgrades | Rural coverage, broad sector deficits, legacy site modernization | Moderate | Medium |
| Small cells | Urban hot spots, campuses, street-level congestion | High | Fast when fiber and power already exist |
| Distributed antenna systems | Stadiums, office buildings, indoor public venues | High | Fast inside the venue once designed correctly |
| Spectrum refarming | Legacy-heavy networks with flexible device support | Moderate | Fast if device compatibility is under control |
What works and what doesn't in the field
Macro upgrades work when the site is severely underpowered or under-sectorized. They don't work well when the load is highly concentrated in one venue or one block.
Small cells work when the goal is to move capacity close to the users. They struggle if fiber, power, or site access is missing.
DAS works indoors because it distributes signal where walls and clutter would otherwise crush performance. It's not the answer for a highway corridor.
Spectrum refarming helps when older layers can be retired or reduced cleanly. It doesn't help much if too many devices still depend on the legacy band.
The best result often comes from pairing tactics. A sector split plus backhaul upgrade can outperform a bigger antenna change alone. A small-cell layer plus traffic steering can outperform a fresh macro site when the hot spot is tightly bounded.
Practical Capacity Planning and Example Calculations
Capacity planning starts with observed congestion, not assumptions. If a sector slows down every weekday evening, the first question is what the users are doing, where they are standing, and which KPI is degrading. That answer shapes the intervention far more than the tower count does.
Ericsson mobility data shows total monthly mobile-network traffic reached 166 exabytes globally in 2024 and rose to 203 exabytes in 2025, a year-over-year increase of approximately 22%, which underscores why capacity must be handled through spectrum, efficient radio technologies, sector upgrades, carrier aggregation, densification, and new deployments (Ericsson key figures).
A workable planning sequence
Start with the hotspot, not the portfolio. Measure busy-hour load, check the worst-performing sector, and look at cell-edge throughput and resource-block occupancy under representative traffic. If the sector is healthy at noon and unstable at dinner, average daily traffic won't help you.
A practical workflow looks like this:
- Identify the hotspot: Pin down the exact time window and geography where complaints cluster.
- Measure the binding constraint: Decide whether the issue is radio efficiency, interference, backhaul, or traffic concentration.
- Check sector loading: Compare active users, uplink demand, and resource-block usage during the busy hour.
- Test the site geometry: Review antenna tilt, azimuth, and sector split before ordering hardware.
- Match the upgrade to the bottleneck: Add spectrum, split sectors, move traffic closer with small cells, or improve backhaul and power.
A realistic hotspot example
A residential cluster with heavy evening fixed wireless demand may look covered on a map and still fail at peak time. If the site has decent RF reach but the sector is saturated, the likely answer is not another wide-area macro. A more useful sequence is sectorization, radio modernization, and backhaul validation, then a small-cell infill if the demand is tightly localized.
The point is to avoid overbuilding. Field measurements, accurate as-builts, and current asset records keep teams from solving the wrong problem at the wrong cost. When the bottleneck is really distribution, a targeted fix is faster and cleaner than scattering new sites across the area.
Capacity-Planning Best Practices and Next Steps
Capacity planning works best when each site is treated as a live system, not a fixed capacity unit. Demand changes by hour and location, so a site can have spare capacity overall while one sector serving a stadium, interchange, or residential cluster struggles during the busy hour. Start by identifying the user-facing bottleneck and selecting the smallest intervention that removes it.
Build the upgrade plan around the binding constraint
If congestion is concentrated in one sector, prioritize the radio layer. If fiber is limiting throughput, improve transport before adding RF load. If demand is concentrated inside a building, stadium, or campus, move capacity closer to users rather than extending the macro layer beyond its practical design.
Operational continuity matters alongside added capacity. Sequence engineering, permitting, construction, testing, and maintenance before work begins. A technically sound upgrade still fails if a changeover creates avoidable service disruption.
A practical best-practice list looks like this:
- Measure first: Use busy-hour and location-specific KPIs rather than daily averages.
- Diagnose the bottleneck: Separate radio, transport, power, and geometry constraints.
- Target the load: Place capacity where users gather, not where the site has spare space.
- Protect continuity: Stage work so service remains stable during changeovers.
- Document the asset: Keep as-builts, test results, and site data current.
Why an accountable partner matters
Capacity projects often lose time at handoffs. Engineering may work from one design, construction from another, and operations may inherit incomplete records. One accountable partner reduces those gaps when the work combines wireless, fiber, and facility infrastructure.
For carriers, neutral hosts, and tower companies, Southern Tier Resources supports that end-to-end model. Its wireless upgrades, fiber-optic infrastructure, and data center fit-outs fit the demands of modern capacity work, where radio relief may depend on transport and power being ready at the same time.
The next step for hot spots, poor uplink performance, or uneven sector loading is a site-level plan based on measurements and current asset records. The plan should state the bottleneck, the intervention, the service-continuity sequence, and the KPI that will confirm improvement.
A congested site needs coordinated work across radio, fiber, power, and field execution. That is how cell tower capacity projects produce targeted improvements instead of adding a macro site that leaves the localized constraint untouched. Visit the Southern Tier Resources site to start a conversation about your next upgrade.