Data centers consumed about 1.5% of global electricity in 2024, and projected demand could reach 650 to 1,050 TWh by 2026. Infrastructure efficiency is improving, but average results have barely moved recently, so operators need to look beyond headline PUE and fix the electrical, thermal, and operational causes of wasted energy.
PUE remains useful because it gives facilities a common measurement boundary. It doesn't tell you whether servers are doing valuable work, whether water use is acceptable, or whether a low ratio depends on operating conditions that won't hold during peak demand. The practical question is no longer just how to lower PUE. It's how to deliver reliable compute while controlling electricity, cooling, water, capacity, and carbon together.
The Growing Urgency of Data Center Efficiency
Data centers used about 1.5% of global electricity in 2024, and projected demand could reach 650 to 1,050 TWh by 2026, according to an International Energy Agency projection summarized by the electrical industry. AI workloads, cloud services, and hyperscale expansion are increasing the computing infrastructure that operators must power and cool. Yet average efficiency gains have slowed, exposing a gap between headline performance and what facilities deliver under changing loads.
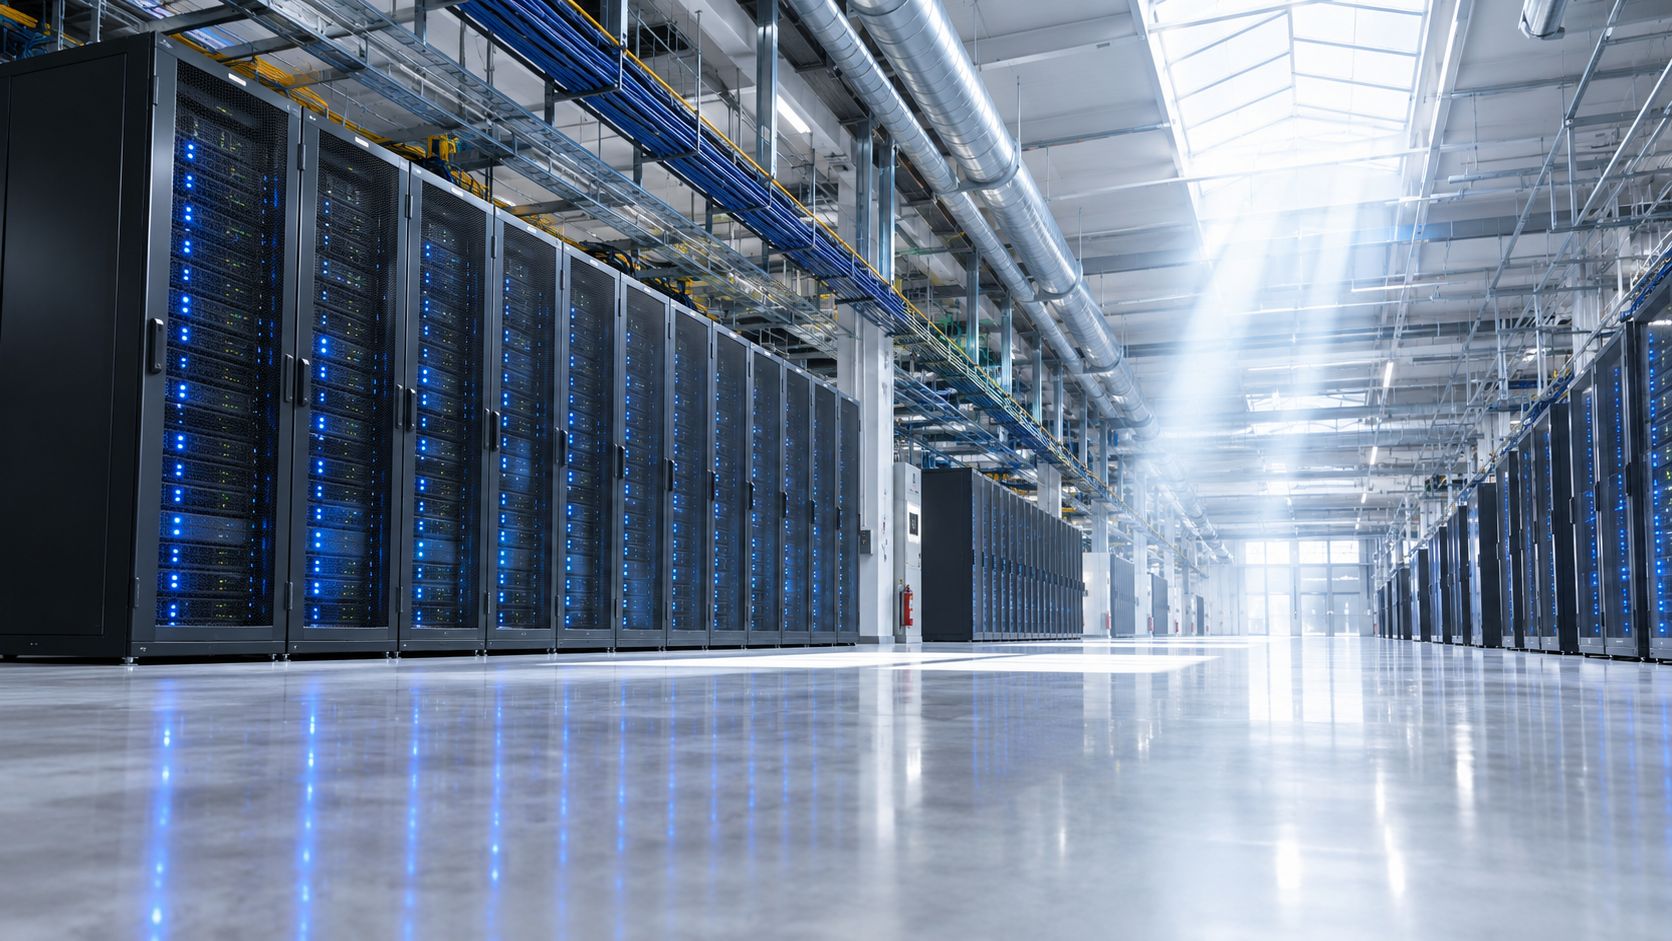
A lower PUE remains useful, but it does not prove that a facility is more efficient overall. A site may reduce cooling overhead while total demand rises, equipment remains underused, water consumption increases, or workloads move to a grid with higher carbon intensity. Data center infrastructure efficiency therefore depends on the useful work delivered, the resources consumed, and the reliability margin preserved.
Why the metric has become strategic
Efficiency decisions now affect teams beyond facilities engineering:
- Power procurement: Electrical demand shapes contract requirements, on-site generation choices, and exposure to constrained supply.
- Grid planning: Large facilities influence utility interconnection discussions and local infrastructure schedules.
- Capacity expansion: Cooling or distribution limits can restrict usable compute even when floor space remains available.
- Sustainability reporting: Electricity, carbon, and water performance require consistent operational data.
- Reliability planning: Removing too much operating margin can turn an efficiency project into a thermal or electrical risk.
The United States shows the scale of this pressure. The Lawrence Berkeley National Laboratory's 2024 United States Data Center Energy Usage Report placed data center electricity use at 76 TWh in 2018, about 1.9% of total U.S. electricity at the time, as documented in its United States data center energy usage report. That historical figure does not predict every future load. It does show why facility improvements must keep pace with expanding digital demand.
Operational reality: A facility is not efficient because its dashboard looks good. It is efficient when it delivers the required workload while controlling energy, thermal, water, and reliability exposure.
Operators should treat efficiency as both a design constraint and an operating discipline. Strong programs connect facility meters with rack behavior, workload placement, maintenance decisions, and expansion planning. They also test whether an apparent improvement reflects real performance rather than a favorable reporting boundary or a temporary low-load condition.
Understanding Key Efficiency Metrics
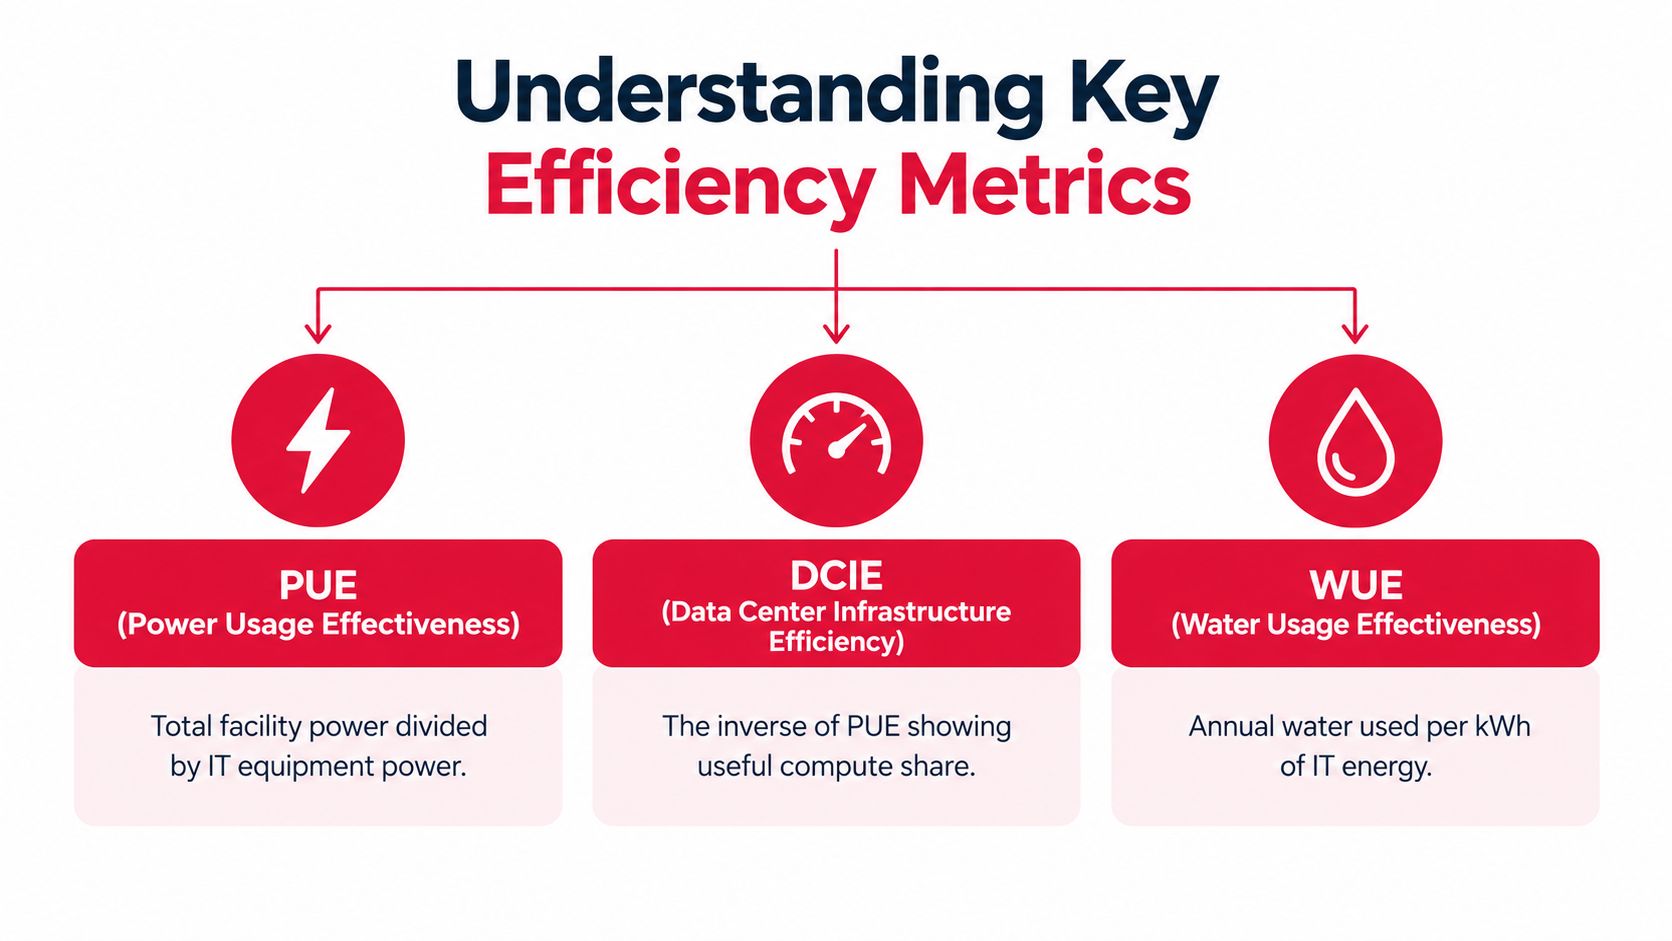
PUE is the starting point, not the complete scorecard. Operators typically need a small group of related measures to understand facility overhead, useful IT energy, and environmental impact.
PUE and DCiE answer opposite questions
Power Usage Effectiveness, or PUE, is calculated as:
PUE = Total facility power ÷ IT equipment power
The Lawrence Berkeley National Laboratory examination of PUE explains that PUE became the dominant infrastructure metric after its introduction by The Green Grid in 2006, and it was later standardized in ISO/IEC 30134-2:2016. A lower number means less facility overhead from cooling, power conversion, lighting, and related support systems.
Industry surveys and expert summaries reported in that examination show average global PUE moving from about 2.5 in 2007 to roughly 1.55 to 1.58 by the mid-2020s, while leading hyperscale facilities are often reported near 1.08 to 1.1. Those long-term gains are significant, but the recent average tells a less optimistic story, as the later monitoring section explains.
Data Center Infrastructure Efficiency, or DCiE, reverses the relationship:
DCiE = IT equipment power ÷ total facility power × 100
DCiE presents the useful IT share as a percentage. It can be easier to communicate to nontechnical stakeholders because a higher value indicates a larger share of facility energy reaching IT equipment. The two metrics contain the same basic information, so teams should choose a convention and apply it consistently.
CUE adds the grid and energy-source context
Carbon Usage Effectiveness, or CUE, relates total carbon emissions from energy use to IT equipment energy:
CUE = Total CO₂ emissions ÷ IT equipment energy
CUE helps explain why two facilities with similar PUE values can have different climate impacts. The result depends on the electricity supply and the emissions factor used in the calculation. It also makes clear why a PUE-only program can miss an important operational trade-off.
These metrics work best as a layered set:
| Metric | Primary question | Main limitation |
|---|---|---|
| PUE | How much facility overhead supports IT? | Doesn't measure useful computational output |
| DCiE | What share of facility power reaches IT? | It's another view of the same boundary as PUE |
| CUE | What carbon impact is associated with IT energy? | Depends on energy-source and emissions data |
For context outside data centers, teams comparing facility performance can also review this resource on the efficiency ratio in retail facilities. The broader lesson is transferable: a ratio is useful only when the measurement boundary, operating conditions, and business output are understood.
The measurement boundary deserves as much attention as the formula. A PUE calculated from inconsistent meter locations can create false improvement. Keep utility, mechanical, electrical, UPS, distribution, and IT readings clearly defined, then compare like with like across time.
How Physical Infrastructure Shapes Efficiency
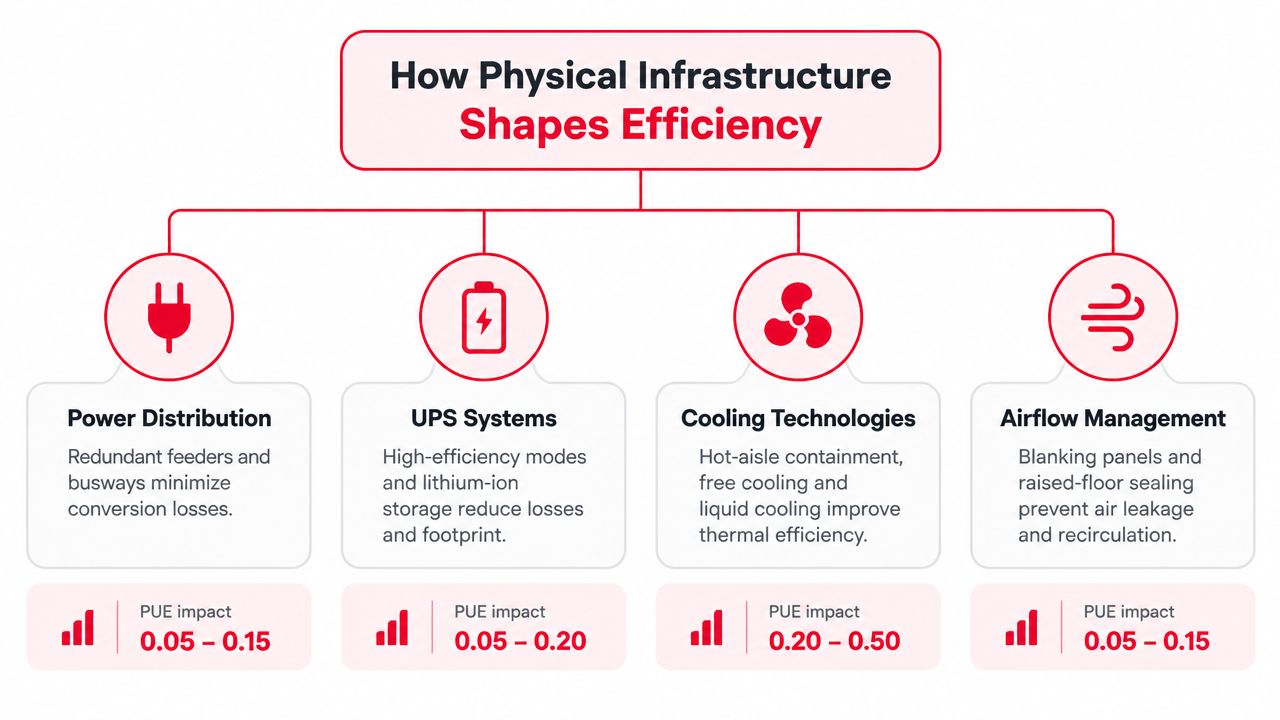
A facility can post an attractive PUE while wasting energy through oversized equipment, lightly loaded electrical paths, or controls that favor operating margin over efficiency. Physical infrastructure determines how much power reaches the IT load and how much is consumed supporting it. The practical target is a design that provides the required redundancy, density, maintainability, and environmental control without adding unnecessary conversion, pressure, or heat-rejection losses.
Electrical paths and UPS systems
Every conversion stage can consume power before electricity reaches the server. Long distribution routes, lightly loaded transformers, extra switchgear stages, and redundancy that does not match the operating profile can leave a facility carrying overhead that delivers no computing capacity. Map the route from the utility entrance to rack input, then identify voltage conversion, standby operation, and distribution losses at each stage.
UPS topology creates another trade-off. High-efficiency modes can reduce conversion overhead, but operators must evaluate bypass behavior, fault response, maintenance procedures, and the facility's tolerance for changes between operating states. A UPS that performs well at one load profile may produce a different result when a room is only partly occupied.
Power distribution should match the deployment pattern. Busways, overhead distribution, and rack-level systems support flexible growth, yet each option affects connection losses, maintenance access, and the amount of installed equipment running below useful capacity. Headline PUE improvements can stall when new capacity is added faster than IT load, because the supporting plant remains energized without a corresponding increase in useful work.
Cooling and airflow
Cooling often provides the largest physical opportunity for improvement. Fans, pumps, chillers, compressors, and heat-rejection equipment operate continuously and respond to both IT demand and outdoor conditions. The most effective changes are often mechanical:
- Containment: Hot-aisle or cold-aisle containment limits mixing and gives cooling units a clearer temperature difference to manage.
- Air sealing: Blank panels, sealed floor openings, and controlled cable penetrations prevent supply air from bypassing rack inlets.
- Fan control: Variable-speed fans should respond to measured pressure and temperature requirements rather than a permanently conservative setpoint.
- Operating envelope: Higher allowable IT inlet temperatures can reduce cooling demand when equipment specifications and reliability requirements permit.
- Economization: Free cooling can reduce compressor operation when outdoor conditions support it.
AI and other high-density deployments expose the limits of air cooling through airflow volume, fan energy, pressure drop, and concentrated rack heat. ASHRAE's AI data center guidance recommends liquid approaches such as direct-to-chip cooling and rear-door heat exchangers, together with thermally segmented zones, for 50 to 100+ kW racks while maintaining applicable thermal and energy standards.
Liquid cooling is an architectural decision
Liquid cooling can support dense compute, but it requires more than replacing an air handler. The design must cover coolant distribution, leak detection, maintenance procedures, heat rejection, water strategy, and the boundary between liquid-cooled and air-cooled equipment.
The U.S. Department of Energy's Data Center Energy Efficiency Handbook identifies 0.8 kW/ton as good HVAC practice and 0.6 kW/ton as a better benchmark, as published in the DOE 2024 revision of its HVAC efficiency guidance. These figures help evaluate mechanical plant performance, but pumps, controls, operating modes, and partial-load behavior still require direct review.
Connectivity and structured cabling affect efficiency less directly than cooling or power conversion, yet poor routing creates operational costs. Congested pathways restrict airflow, complicate maintenance, and limit future high-density deployments. Teams planning cloud transitions can also use AWS vs Azure migration for enterprise teams when aligning workload architecture with the physical infrastructure that supports it.
Measuring and Monitoring Efficiency in Real Time
A monthly utility bill can show that energy use changed. It can't tell an operator which room, rack, cooling unit, or electrical path caused the change. Real-time monitoring turns efficiency from a reporting exercise into a control loop.
The minimum useful architecture has multiple measurement layers:
- Facility level: Utility entrance and major generation or interconnection points.
- Mechanical level: Chillers, pumps, cooling towers, CRAH or CRAC units, and heat rejection.
- Electrical distribution: Switchgear, transformers, UPS output, PDUs, and branch circuits.
- IT level: Rack or row power, intelligent PDU output, and representative equipment loads.
- Environmental level: Inlet temperature, humidity, differential pressure, leak detection, and room conditions.
Uptime Institute's 2024 survey reported an industry-average PUE of 1.56, as documented in its Global Data Center Survey. Its later survey described only marginal improvement, with the average remaining in the same general range. In practical terms, a typical site still carries roughly 56% extra facility energy beyond IT load, so operators need visibility into the systems creating that overhead.
Build feedback, not dashboards
A dashboard becomes useful when it triggers an action. Set alerts for abnormal temperature spread, rising fan demand, unexpected UPS loading changes, cooling units operating outside their expected sequence, and rack circuits approaching design limits. Correlate those events with work orders and change records so engineers can tell whether a configuration change improved performance or only moved the problem elsewhere.
Thermal mapping is especially valuable during expansion. A room average can look acceptable while a rack inlet experiences a localized hot spot. Sensor placement should represent rack faces, containment boundaries, and the areas most likely to change as equipment density rises.
Teams evaluating sensor and gateway approaches can review industrial IoT monitoring from DUCHENG as background on connecting distributed operational devices. The implementation choice matters less than data quality, timestamp consistency, calibration, and clear ownership of corrective actions.
Measurement rule: Don't compare PUE values until you can explain exactly where facility power and IT power are measured, under what load, and with which sensors.
Practical Strategies for Efficiency Improvement
The most effective improvement programs start with low-risk operational changes, then fund infrastructure work where measured data shows a persistent constraint. IT-side tuning alone rarely moves facility overhead very far. The major levers sit in fans, pumps, chillers, power paths, controls, and inlet-temperature compliance.
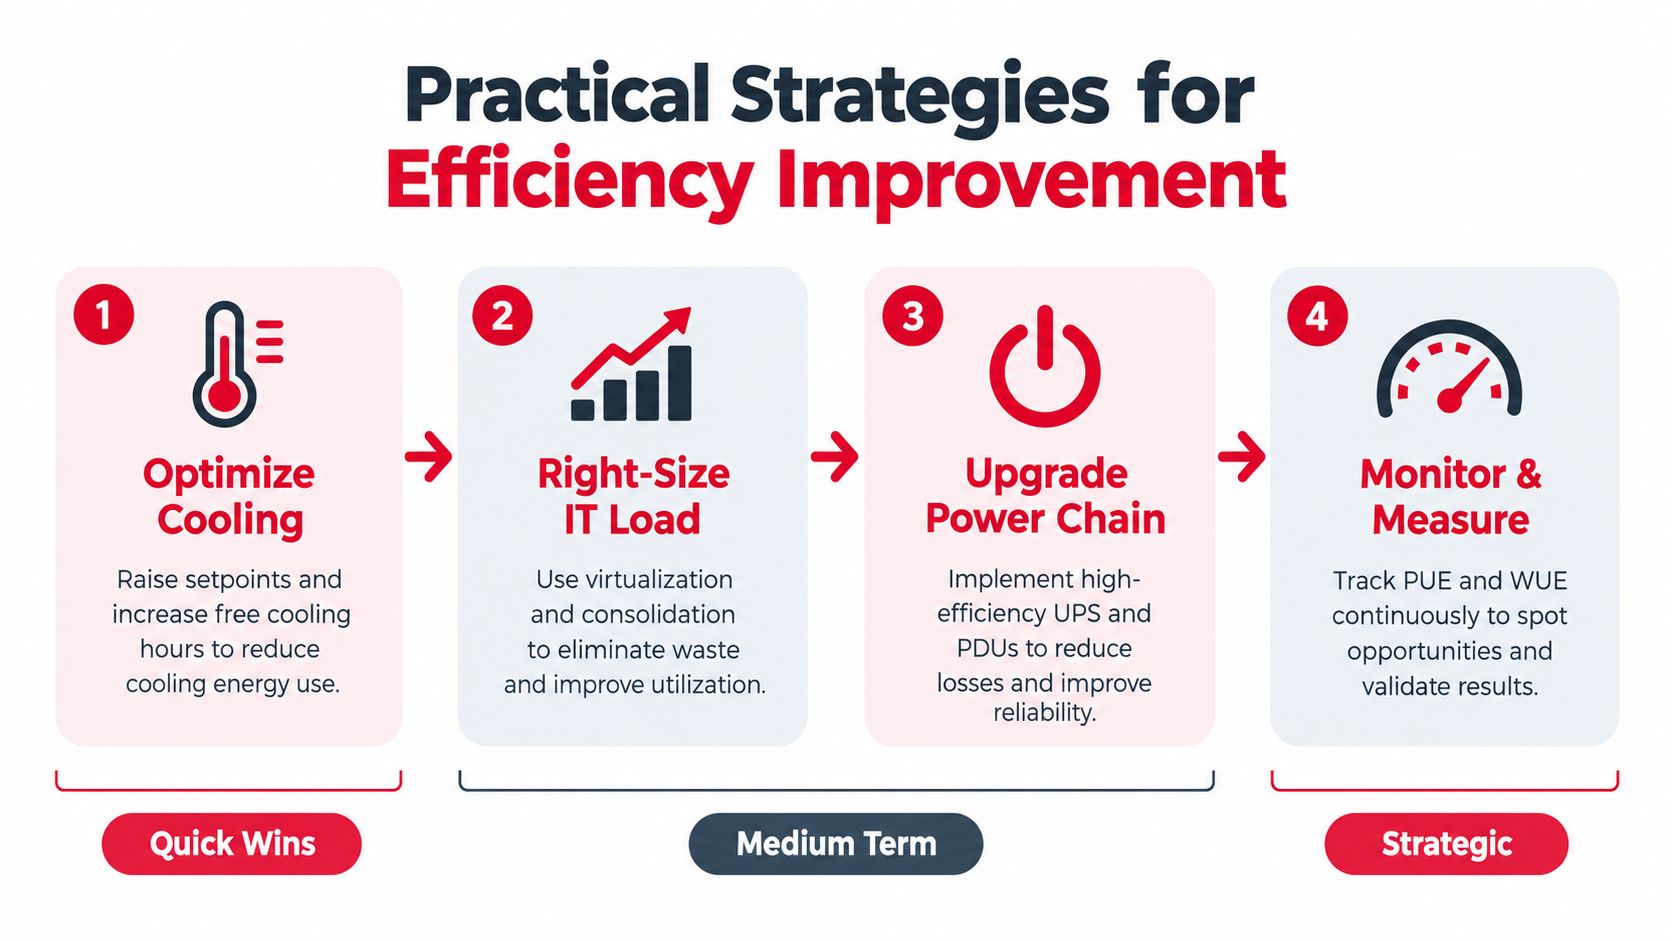
Start with controlled operating changes
Begin by confirming that racks operate within the intended inlet-temperature envelope. A conservative setpoint applied across an entire room can force every cooling unit to work harder because of a localized issue that better airflow management would solve.
Prioritize actions that are reversible and observable:
- Correct bypass airflow: Install missing blanking panels, seal floor penetrations, and repair containment gaps.
- Tune fan control: Match fan speed to measured pressure and rack demand instead of fixed maximum operation.
- Sequence cooling units: Prevent redundant units from fighting one another or running unnecessarily at low load.
- Use economization carefully: Extend free-cooling operation where climate, humidity, filtration, and equipment requirements allow.
- Remove idle equipment: Consolidate workloads and retire unused devices only after capacity and resilience checks.
The ASHRAE thermal-efficiency guidance specifically links higher allowable IT inlet temperatures with lower cooling energy use. The operational requirement is discipline. Engineers must validate equipment limits, sensor accuracy, alarm thresholds, and seasonal behavior before changing setpoints.
Match capital work to the actual bottleneck
If monitoring shows distribution losses or conversion overhead, evaluate the power chain before purchasing additional cooling. If rack density is the constraint, liquid cooling or rear-door heat exchangers may create more usable capacity than adding conventional air handlers. If the mechanical plant performs well at full load but poorly at partial load, controls and staging may deliver more value than a wholesale replacement.
A practical sequence is:
- Baseline: Establish a consistent PUE measurement boundary and trend it under representative loads.
- Optimize: Correct airflow, fan, sequencing, and setpoint issues.
- Right-size: Align UPS, cooling, and distribution capacity with actual and forecast demand.
- Upgrade: Invest in power-path redesign, efficient UPS systems, economization, or liquid cooling where evidence supports it.
- Verify: Compare post-change performance under comparable conditions and document reliability outcomes.
Do not treat a lower PUE as the only success criterion. A change that saves facility energy but reduces maintainability, increases water exposure, or narrows failure tolerance may be a poor engineering decision. The right result is lower resource overhead without sacrificing availability or future deployment flexibility.
Case Study – Efficiency Gains Through Infrastructure Optimization
A representative operator begins with a familiar problem: the facility's headline PUE appears acceptable, but new high-density racks cannot be deployed in the intended room without creating thermal alarms. The mechanical team sees uneven inlet temperatures, while the electrical team sees unused capacity stranded behind a distribution arrangement designed for an older rack profile.
The first step isn't a major equipment purchase. Engineers validate meter boundaries, map rack inlet conditions, inspect containment, and review UPS and cooling-unit loading. They find that airflow bypass and uneven rack placement are forcing cooling equipment to operate more conservatively than the room's average temperature suggests.
The intervention
The operator divides the room into thermal zones, corrects floor and containment leakage, and changes fan control to respond to measured conditions. The electrical team reviews the power path and adjusts rack distribution to support the target deployment without extending unnecessary conversion stages. For the densest racks, the design shifts toward liquid-assisted heat removal rather than trying to force all heat through the existing air system.
The work is staged. Each change has a rollback plan, a defined observation period, and a reliability review. Engineers track facility power, IT load, inlet temperatures, cooling-unit states, UPS behavior, and alarms together instead of claiming success from a single PUE reading.
What the operator learns
The case doesn't produce a universal ROI figure because the value depends on energy prices, equipment condition, workload demand, and expansion timing. It does show why infrastructure optimization is rarely one upgrade. Airflow correction can release cooling headroom, electrical redesign can release rack capacity, and thermal zoning can make high-density deployment predictable.
The common failure is to install a new cooling technology before understanding the existing room. Liquid cooling won't compensate for poor measurement, incorrect rack placement, or inadequate maintenance procedures. Similarly, a highly efficient UPS won't solve a thermal bottleneck.
Engineering lesson: Treat the facility as one coupled system. Power, cooling, rack layout, cabling, workload placement, and maintenance access constrain one another.
Designing for Efficiency From the Start
New facilities offer the best opportunity because site, architecture, power, cooling, connectivity, and expansion decisions can be coordinated before they become expensive retrofits. Select sites with realistic utility, climate, water, and network constraints, then model the intended rack density instead of designing for an abstract average load.
Redundancy should be sized around the required availability outcome, not copied from a legacy template. Coordinate busways, UPS systems, switchgear, cooling distribution, containment, structured cabling, and liquid-cooling readiness with the actual deployment roadmap. Define measurement boundaries and sensor locations during design, so the operator can verify performance from day one.
Efficiency is strongest when it remains measurable after commissioning. Build acceptance testing, thermal validation, power-quality checks, and operating procedures into the handover package rather than treating them as optional documentation.
Southern Tier Resources provides data center infrastructure fit-outs for hyperscale and enterprise facilities, integrating power, connectivity, and structured cabling for reliable, scalable deployments. If you're planning a new build, expansion, or infrastructure upgrade, visit Southern Tier Resources to discuss engineering, construction, testing, and maintenance support.