You've got the dashboard open, the SLA says the site is healthy, and the trouble tickets keep climbing anyway. Maybe the network just “looks” fine on paper while customer experience is sliding, or a data hall is hitting its throughput target while latency tails get uglier every week. That's the moment performance benchmarking stops being a reporting exercise and starts being an operational control.
The work only gets useful when you compare baseline measurements against your own history, peers, and accepted standards, then keep doing it long enough to separate real change from normal variation. In digital analytics, Avinash Kaushik recommends using at least a couple of years of trend data so month-over-month changes can be compared across years, because a long time series gives you a more reliable internal benchmark than a single snapshot (Kaushik on benchmarking digital analytics performance metrics). That same logic applies in telecom and data-center operations, where seasonality, build phases, and workload shifts can make a good-looking point-in-time number misleading.
The best operators treat benchmarking as a cycle, not a one-time audit. They define objectives, select metrics, collect baseline data, compare gaps, and turn those gaps into an action plan, which is exactly why strong benchmark programs look more like engineering discipline than a slide deck (U.S. guidance on benchmarking workflow). If you need a practical way to translate that mindset into application or service monitoring, it helps to compare .NET performance baselines against the same idea: trend first, then trust the comparison.
What Performance Benchmarking Really Measures in Infrastructure
A carrier can celebrate 99.95% uptime and still lose trust if the customers who care about interactive experience are seeing retries, jitter, or slow handoffs. A data center can post solid aggregate throughput and still disappoint if tail latency keeps creeping up under real load. The mistake is usually not bad math, it is confusing a headline metric with operational truth.
A useful benchmark answers a harder question: what changed in the system, under what conditions, and compared with which baseline. If the case mix shifts, the geography changes, permitting slows the build, or construction complexity rises, the comparison can look clean while the underlying work got harder. That is why benchmark validity has to be treated as a first-class issue, not an afterthought buried in the report.
A snapshot tells you less than a trend
Benchmarking measures how a system performs relative to its own history, external peers, or published standards. In practice, that means you start with baseline measurements before you compare changes over time, because trends show whether a build, a vendor swap, or a new operating pattern improved the system. Kaushik's guidance to use a long enough time series is useful here, because recurring demand patterns can otherwise look like progress or regression when they are really just seasonality (Kaushik on benchmarking digital analytics performance metrics).
For infrastructure operators, benchmarking is also about repeated comparison. Industry guidance describes it as comparing products, services, processes, or operational metrics against competitors or established standards to identify improvement opportunities, and it treats benchmarking as a repeatable cycle tied to continuous improvement (benchmarking as a management method). That matters because a one-off report can tell you what happened, but it will not tell you whether the improvement survived the next release, the next crew, the next weather event, or the next permit delay.
Practical rule: If the result cannot be trended, repeated, and compared against a defined baseline, it is reporting, not benchmarking.
The numbers that matter in the field
In telecom and data-center environments, the useful measures usually sit closer to the work than the marketing deck does. Throughput, response time, uptime, error frequency, and resource usage are common because they capture efficiency and reliability in measurable terms. Those same categories show up whether you are looking at a fiber build, a wireless rollout, or a colocation fit-out, including data center infrastructure solutions.
The most useful frame is simple. Benchmarking tells you whether the current operating pattern is better, worse, or just different from what you expected. It does not replace root cause analysis, but it does tell you where to focus the next engineering hour. A good baseline also makes continuous benchmarking possible, because you can keep comparing the same system across operating cycles instead of treating each report as a fresh start.
If you are checking application or service monitoring in a .NET stack, it helps to compare .NET performance baselines against the same idea, trend first, then trust the comparison.
Defining Objectives, Scope, and the Right KPIs
A benchmark only matters if everyone agrees on what is being measured before the first sample is taken. In practice, that means defining the population, time window, charting frequency, comparison type, and calculation method up front, so the team does not end up comparing the wrong sites, the wrong crews, or the wrong build phases (benchmarking scope and calculation guidance). Without that frame, the numbers can look precise and still point engineering in the wrong direction.
Scope is where benchmark validity starts. Case mix, geography, permitting, and build complexity all change the result, so the benchmark has to be set up around the work itself, not around a convenient spreadsheet export. If one region is handling tighter right-of-way conditions, different soil, or more complex site access, its output may look weaker even when the crew is performing well. That is not a reporting problem. It is a scope problem.
Pick KPIs that match the domain
A wireline build does not need the same benchmark package as a wireless optimization cycle or a data-center fit-out. The point is to measure what controls the business result, not what is easiest to pull from a tool.
| Domain | Leading KPIs | Why It Matters |
|---|---|---|
| Wireline | Splice loss, OTDR reflectance, MTTR | Shows whether the plant is clean, testable, and supportable |
| Wireless | RSRP, SINR, handover success, drop rate | Reveals coverage quality and mobility behavior |
| Data center | PUE, rack density, structured cabling certification, latency under load | Ties physical fit-out quality to efficiency and service behavior |
Those are starting points, not a universal set. Technical benchmarking practice usually centers on throughput, response time, uptime, error frequency, and resource usage, because those measures capture efficiency and reliability in ways teams can compare over time (technical benchmarking metrics). The better move is to start with a small, defensible set that the operations team can act on, then widen the set only when the added metric changes a decision.
A good KPI set also has to survive continuous benchmarking. If a measure cannot be trended across releases, crews, or operating periods, it may be interesting, but it is not helping anyone manage the business. That is why the same metric should mean the same thing in every reporting cycle, even when the context shifts.
Make the benchmark answer one operational question
A strong benchmark program starts with a question that an operator can use. If the objective is to compare fiber crews, the question might be whether one crew consistently delivers cleaner test results and fewer rework events. If the objective is wireless tuning, the question could be whether a region improved handover behavior without hurting drop performance. If the objective is a data-center expansion, the question is whether the fit-out stayed within the expected operating envelope after load came online.
The scope has to match that question. If the team is measuring build quality, the benchmark should exclude unrelated noise from a different region, a different permitting path, or a different construction sequence. If the team is measuring service behavior, it should not mix test windows that include different traffic patterns, different asset vintages, or different maintenance states. That is how invalid comparisons sneak in.
The calculation method needs the same discipline. Once the team agrees on how a KPI is defined and rolled up, keep that method fixed so later results can be compared without debate over definitions. The goal is not to make the report easier to read. The goal is to make the next decision better than the last one.
Designing Lab Tests and Field Tests That Match Reality
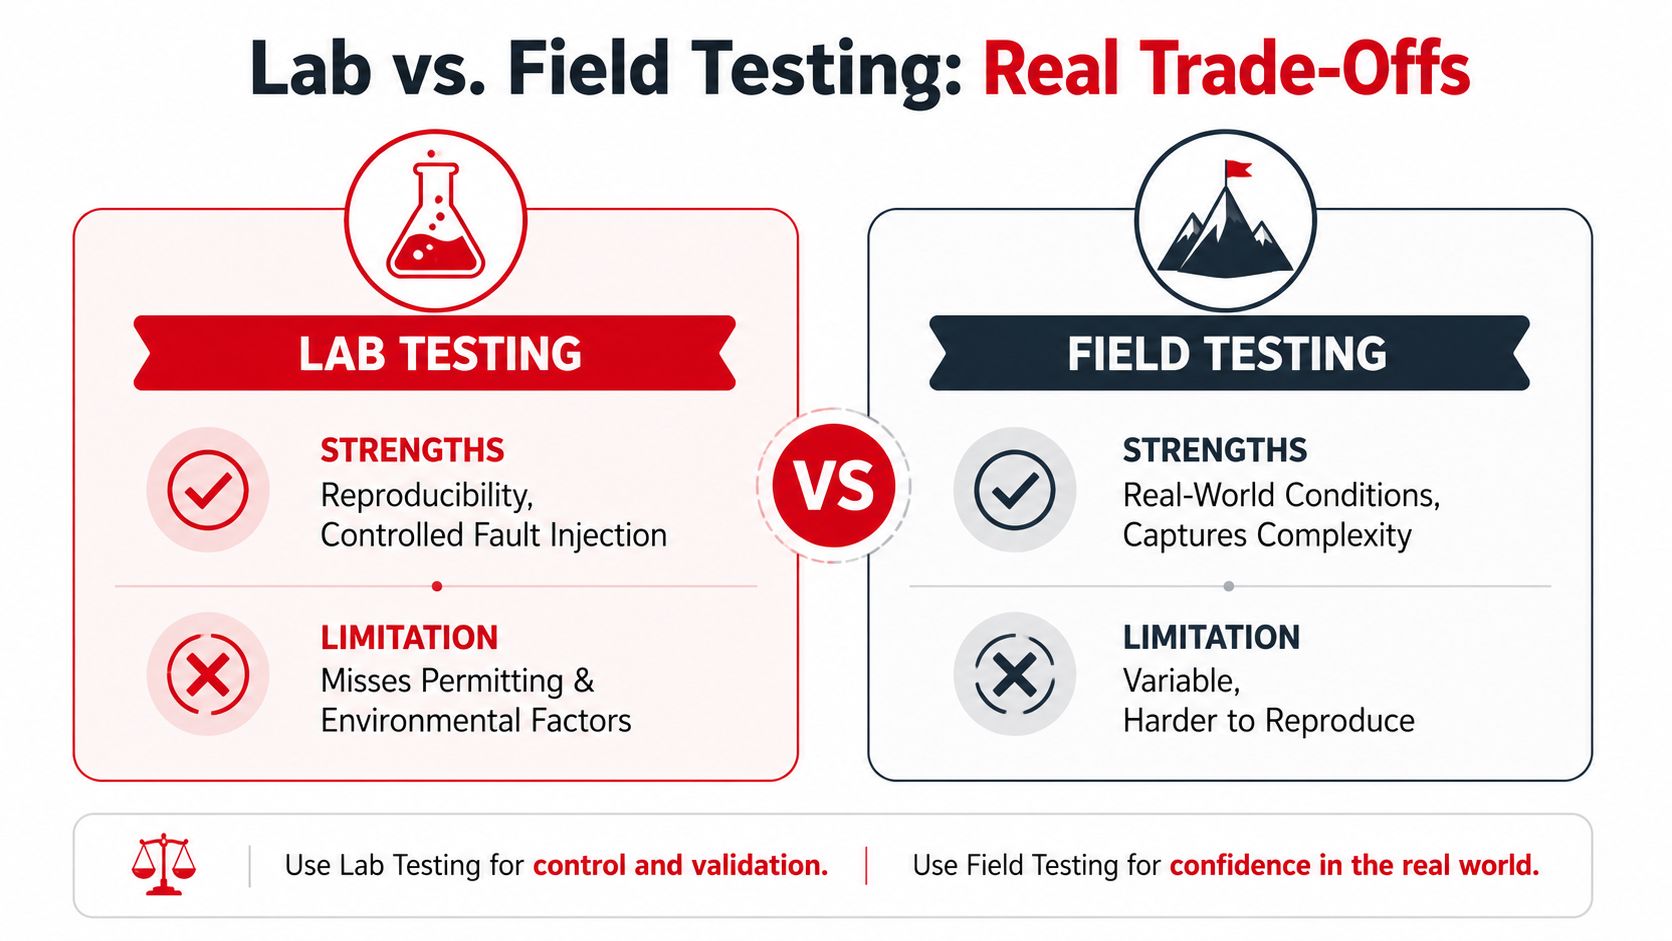
Lab tests earn their place because they're reproducible. Field tests earn their place because they're real. Neither one is enough by itself when the question is whether a change will survive crews, weather, permitting delay, traffic mix, and the messy conditions that define infrastructure work.
Use the lab when you need control
Lab environments are the right place for controlled fault injection, hardware swaps, and vendor comparisons that would be hard to isolate in the field. You can hold variables steady, rerun the same condition, and catch regressions without arguing about whether a storm, a truck roll delay, or a shared-spectrum issue changed the result. That repeatability is what makes lab data defensible.
Use the field when the workflow matters
Field testing is the better choice when integration, permit timing, route density, environmental exposure, or crew workflow can shift the outcome. A clean lab pass doesn't guarantee the same result once the build touches real geography and real operations. The field also exposes contamination risks, like mixing new and legacy segments in the same comparison window, which makes the results harder to trust.
For telecom and data-center operators, the best practice is often a paired model. Anchor the test plan in the lab, then run parallel field trials on a narrow scope before broad rollout. If the results differ, don't assume the lab was wrong or the field was noisy. Check whether the comparison included the same population, the same window, and the same installation or load conditions.
A good benchmark is one you'd be willing to defend in front of an engineering review without hand-waving. That's why a clean baseline window and a written test plan matter more than a pretty chart. Field data becomes far more useful when the collection method is stable enough that the next run can be compared directly against the last one.
Workloads, Tools, and Statistical Discipline You Cannot Skip
A benchmark that does not resemble production is usually a demo, not a test. In carrier networks, data centers, and field deployments, the workload has to reflect the mix of traffic, retries, ramp-up, steady state, and decline the system sees in service. Synthetic spikes still have a place, but they should support the decision, not define it.
Build the workload from real behavior
Use production-derived workload shapes rather than invented bursts. Pull the pattern from logs, then replay the ramp-up, peak, and decline so the benchmark tracks how the system behaves under pressure (production-derived workload guidance). That matters when load arrives unevenly, because a clean synthetic peak can hide the point where latency, loss, or throughput starts to drift.
The same discipline applies to fiber work in the field. If you are validating cable performance, keep the test method aligned with the installation type and the expected operating conditions, and use a clear procedure such as how to test fiber optic cable so the result can be repeated by another crew without guessing at the setup.
Run the same test at least 5 identical iterations, and 10+ when the decision is high stakes, then calculate the mean and standard deviation. If the coefficient of variation rises above 5%, treat that as a sign the environment is unstable and investigate before trusting the result (benchmark iteration and variation guidance). That does not solve every measurement problem, but it does keep a shaky setup from passing as a valid result.
Do not approve a benchmark until the environment itself has been checked.
Use the right tools for the layer
The tool has to match the layer you are measuring, or the output becomes hard to trust and harder to act on.
- Fiber testing: OTDR and OLTS give you the optical view needed for loss and reflectance work.
- Wireless testing: Drive-test kits and scanner-based collection help you see coverage and handover behavior in real environments.
- IP and application testing: iPerf and synthetic transaction tools are useful when the question is transport behavior or service response.
- Facilities and operations: BMS and DCIM data let you compare equipment behavior, utilization, and load trends in the data center.
Run-book discipline matters as much as the instrument choice. Keep versions, test order, calibration status, and operator steps stable from one campaign to the next. If two teams cannot run the same test and get a comparable result, the benchmark is not strong enough to drive action.
Continuous benchmarking works only when the same workload, the same toolchain, and the same review method are carried forward from one run to the next. That is what makes the numbers useful in real operations, because the comparison stays anchored to the workload you serve instead of drifting toward whatever was easiest to measure.
Making Comparisons Fair When Context Distorts the Numbers
A clean spreadsheet can still produce a bad comparison. A rural fiber build and a dense urban fiber build do not face the same permitting, access, or construction constraints, so a straight cost or cycle-time ranking can punish the harder geography and reward the easier one. A hyperscale data center in a cold climate should not be judged against one in a hot climate on PUE alone if the operating context is materially different.

Context is part of the metric
Benchmark validity is the first question to answer. Peer-reviewed work on benchmarking methods shows that crude comparisons can be biased, and that adjustments such as propensity scores, causal variables, or sample-selection models may be needed to reduce that bias (benchmark validity and adjustment methods). Infrastructure teams face the same problem, even if the adjustment method is less formal.
The practical answer is segmentation. Separate peers by geography, density, build complexity, permitting burden, or operating model before you compare them. Write down the assumptions in the benchmark file, because a benchmark without assumptions tends to look objective until someone asks why two unequal sites were placed in the same peer group.
Fair comparisons survive scrutiny
APQC notes that benchmarking projects fail when organizations do not define scope, assumptions, and comparable measures up front, which is often why a benchmark looks wrong or inconsistent across teams (APQC guidance referenced in the benchmark validity literature). That warning matters in infrastructure because permitting delay, network density, terrain, and build complexity can move the numbers even when everyone agrees the KPI is standard.
Field conditions always add variation the lab cannot fully reproduce.
The best peer group is the one your operations team can defend in a review. If the comparison does not survive a check of case mix and geography, it should not be used to judge performance or assign blame.
A practical cabling reference that keeps the physical layer comparison grounded is Southern Tier Resources' data center cabling standards guidance. The point is not to hide variation. It is to measure it well enough that the comparison still means something.
Turning Benchmark Results Into SLA, Reports, and Remediation
A benchmark only changes behavior when it's tied to documents people already use. SLA language, vendor scorecards, internal QA reports, and executive dashboards are where the result becomes real, because that's where accountability lives. If the benchmark sits outside those documents, the same argument will come back in the next review cycle.
Write the SLA to match the benchmark
SLA language should reference the benchmark definition itself, not a vague target that everyone interprets differently. That means the metric, calculation method, comparison window, and escalation path all need to point back to the same definition. If the SLA says uptime but the operating team tracks availability on a different window or population, disputes are inevitable.
Vendor scorecards work best when they mirror that same benchmark structure. That gives procurement, operations, and engineering a shared yardstick instead of three competing ones. Internal QA reports should then document the gap, the suspected cause, and the evidence collected so far, while the executive dashboard shows the trend direction without drowning leadership in operational noise.
Use a repair loop, not a blame loop
A useful remediation flow looks like this, and every step should leave evidence behind:
- Detect: Capture the deviation with the agreed benchmark and baseline.
- Root-cause: Tie the gap to a system, crew, vendor, or site condition.
- Assign: Give ownership to the team that can fix it.
- Verify: Re-test under the same benchmark conditions.
- Re-benchmark: Confirm the change held in the next review window.
Quarterly review packs should show both the point-in-time result and the trend line. That combination tells leadership whether the organization is recovering, stalling, or drifting. When the trend is worse than the single number, the trend is the primary story.
The strongest programs keep the evidence chain intact from detection to re-benchmark. That way, the next dispute starts with facts instead of recollection.
Operationalizing Continuous Benchmarking
Benchmarking works best when it's built into operating cadence instead of being scheduled only when someone is unhappy. Weekly operational checks catch noise early, quarterly peer reviews compare sites or teams, and annual strategic assessments keep the benchmark aligned with long-term business goals. The point is to create rhythm, not extra bureaucracy.
Make ownership explicit
A RACI model keeps the program from becoming everybody's job and nobody's job. One person or team should be Responsible for collecting the data, another Accountable for the decision, with the right reviewers Consulted and the rest Informed. If that sounds basic, good. Basic governance is what keeps benchmark data usable over time.
Automation helps when it pulls directly from operational sources instead of manual spreadsheets. NMS, DCIM, and test gear can feed the cycle if the definitions stay stable and the extraction rules are documented. For cost-aware programs, a resource like the PushOps DevOps platform can be useful when you're thinking about benchmarking alongside cost-performance tradeoffs, especially as workloads and operating constraints keep changing.
Start small, then widen the cycle
A 90-day rollout can stay simple if the first domain is clear. Pick one operational area, lock the baseline, automate the data pull, run the first comparison, and review the result with the people who can act on it. Once that loop is reliable, extend it to wireline, wireless, and data center in sequence instead of trying to standardize everything at once.
The newest benchmark programs also need room for meta-metrics and cost-performance tradeoffs, because the “best” setup changes as workloads and constraints evolve. That's the shift from one-time ranking toward ongoing optimization under changing conditions, which is where continuous benchmarking earns its keep (systems-level benchmark evolution). The programs that win are the ones that keep the definitions stable while the operating context changes around them.
If you need a partner that can help you turn measurements into field-ready action, benchmarking won't get easier by waiting. Southern Tier Resources can help you move from isolated checks to a repeatable operating standard, so use this moment to start a conversation with Southern Tier Resources about the infrastructure work that needs to hold up under real conditions.