When you're dealing with fiber optic cable, testing isn't just a final checkbox—it's the core of a successful installation. It involves using specialized equipment like an Optical Time-Domain Reflectometer (OTDR) and an Optical Loss Test Set (OLTS) to get a clear picture of the cable's health, measuring everything from light loss and reflectance to overall link continuity. This process is what certifies that a cable meets performance standards before it carries live traffic, saving you from a world of expensive headaches down the road.
Why Proper Fiber Optic Testing Is Non-Negotiable

Before we jump into the "how," let's talk about the "why." In my experience, treating fiber testing as an afterthought is one of the biggest mistakes a team can make. It’s not just about getting a green light; it’s about fundamental quality assurance for the entire network. Skimping on this step is practically asking for future network failures.
Think about it this way: a brand-new data center link starts dropping packets intermittently. Without baseline test reports, your technicians are flying blind. They could waste days—or even weeks—chasing a problem that a quick five-minute OTDR trace would have flagged before the system ever went live. I’ve seen it happen. A simple macrobend hidden inside a wall panel can bring a multi-million dollar project to a screeching halt.
The True Cost of Insufficient Testing
The fallout from poor testing goes way beyond a spotty connection. For a carrier or an ISP, one bad link can trigger a widespread outage, leading to SLA breaches and a serious hit to their reputation. In a hyperscale data center, even a single faulty connection can throttle the performance of thousands of virtual machines, impacting countless users and critical business operations.
All these risks point to one of the unwritten rules of our field:
The cost of doing the testing right the first time is a tiny fraction of the cost of an unplanned outage. Proactive certification always beats reactive troubleshooting.
The industry gets it. The global fiber optic test equipment market is on track to grow from USD 1.18 billion in 2025 to a projected USD 2.07 billion by 2033. This isn't just numbers on a chart; it reflects a massive demand for certified, high-performance fiber networks across every industry. You can learn more about the market's expansion and its driving factors to see where things are headed.
Safeguarding Your Network Investment
Ultimately, getting comfortable with both Tier 1 (loss) and Tier 2 (OTDR) testing is about protecting your investment. A solid test report is like a birth certificate for each fiber link, giving you a detailed performance baseline from day one.
This documentation is incredibly valuable for a few key reasons:
- Verifying Installer Workmanship: It's your proof that the installation was done correctly and meets industry standards, like those from the TIA.
- Accelerating Future Troubleshooting: When a problem eventually pops up, technicians have a "known good" state to compare against, cutting down diagnosis time dramatically.
- Ensuring Day-One Performance: It gives you the confidence that the network can handle its intended applications right out of the gate.
Assembling Your Essential Fiber Testing Toolkit
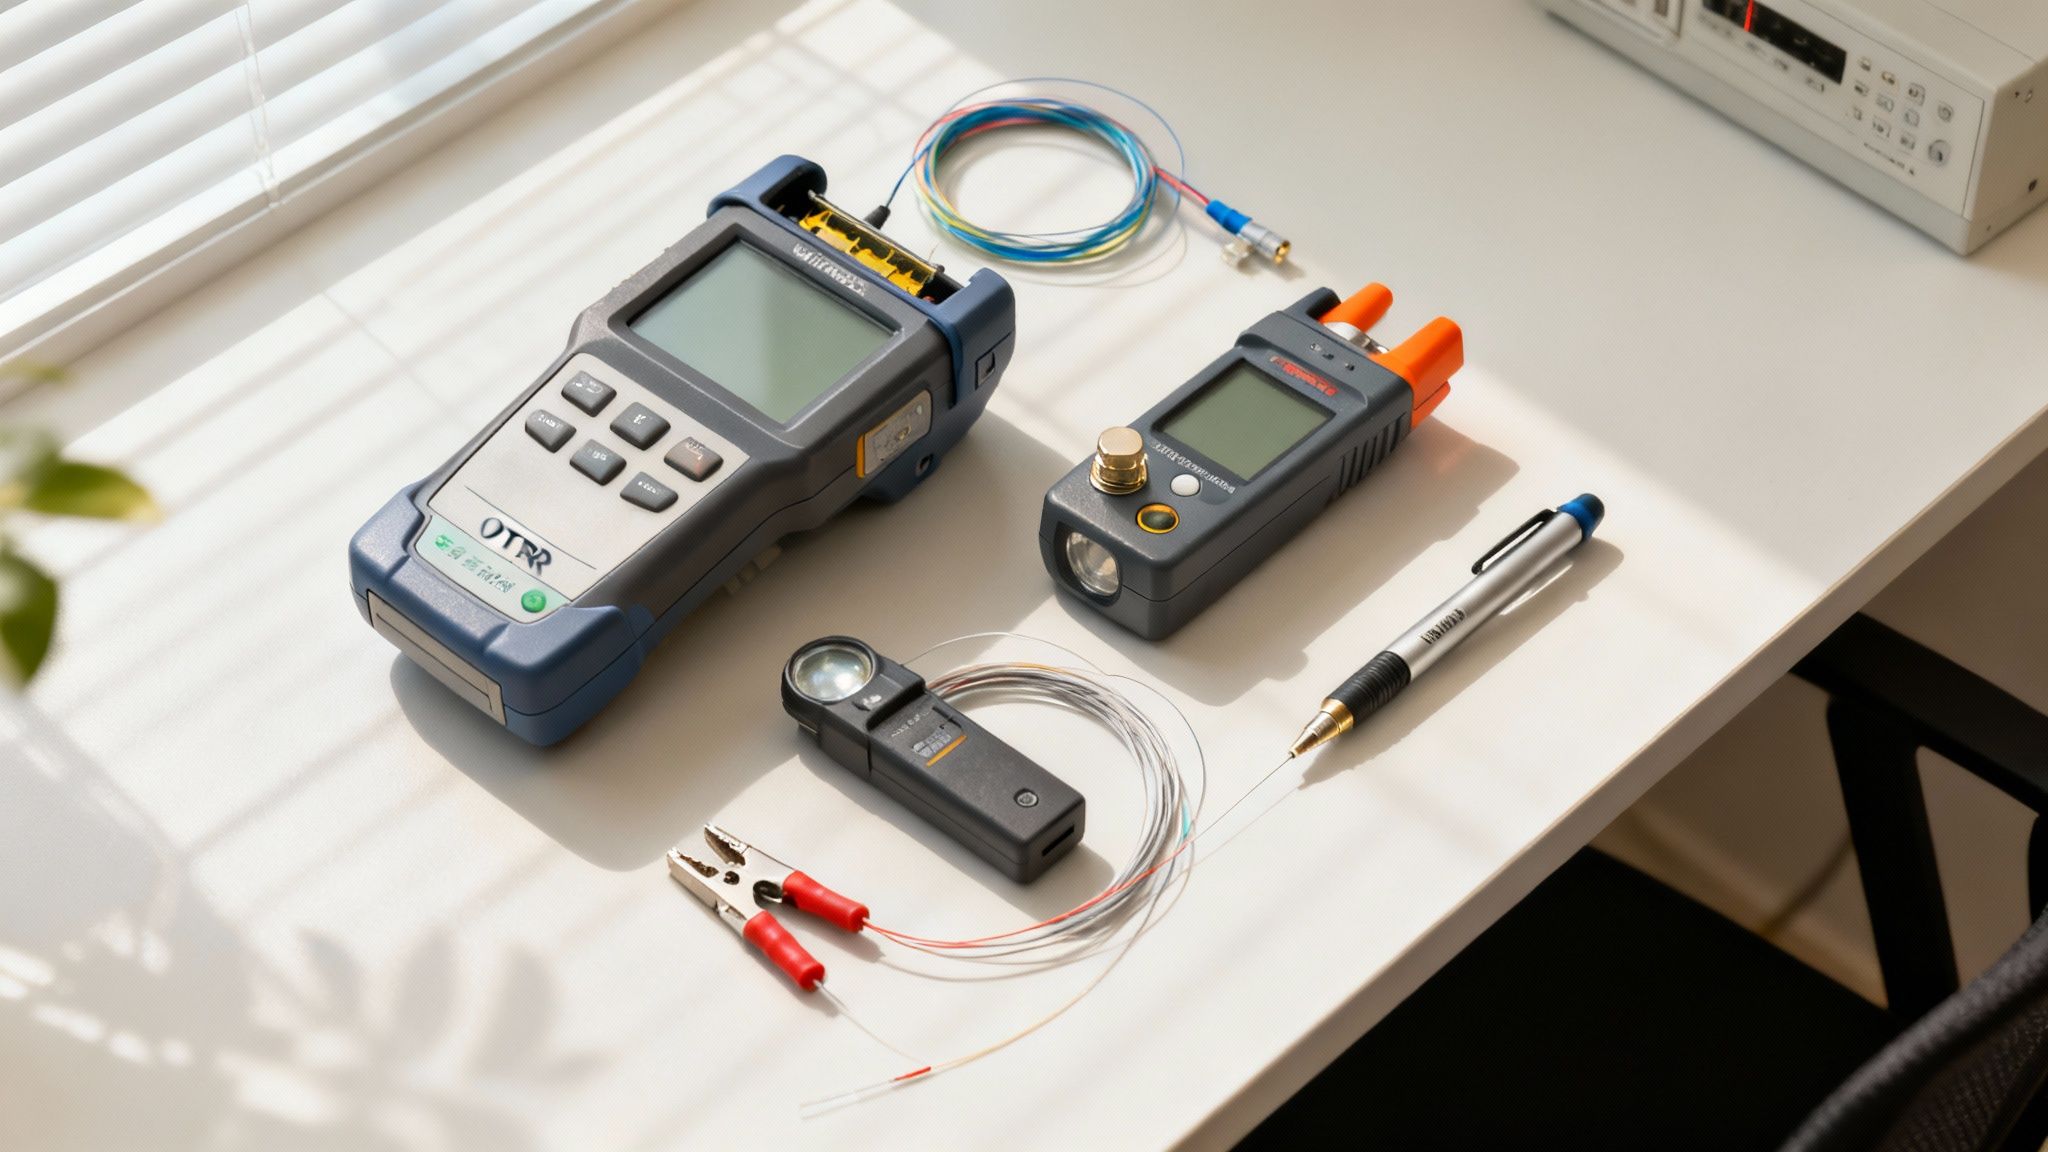
Showing up to a site without the right gear is a recipe for a bad day. You simply can't do the job properly. Any accurate fiber test hinges entirely on the tools you bring, and knowing what each piece of equipment does is fundamental to getting reliable results.
Your toolkit isn't just for finding faults; it’s for proving you did the job right from the very beginning. Let’s walk through the non-negotiable tools every serious fiber technician needs in their bag and clarify the exact role each one plays in a professional workflow.
To start, here’s a quick overview of the essential tools and what they're used for in the field.
Core Fiber Optic Testing Equipment and Primary Use Cases
| Tool | Primary Function | What It Measures or Identifies | Typical Application |
|---|---|---|---|
| OLS & OPM (OLTS) | Tier 1 Loss Testing | Total signal loss (insertion loss) in decibels (dB) and power levels (dBm). | Certifying new installations against a loss budget; basic pass/fail checks. |
| OTDR | Tier 2 Link Characterization | Distance to events, loss of splices/connectors, reflectance, and fault locations. | Troubleshooting faults, certifying long-haul links, and creating a detailed "birth certificate" for a fiber run. |
| Fiber Inspection Scope | Connector End-Face Inspection | Contamination (dust, oils), scratches, pits, and cracks on the connector surface. | The first step before any connection is made to prevent damage and high loss. |
| Visual Fault Locator (VFL) | Continuity & Fault Pinpointing | Breaks, sharp bends (macrobends), and bad splices by emitting a visible red light. | Quickly identifying a specific fiber in a patch panel or tracing a fault within a few kilometers. |
Think of this table as your go-to reference. Now, let’s dig a bit deeper into what makes each of these tools indispensable.
The Workhorses for Loss and Power Measurement
At the most basic level, you need to know if enough light is getting from point A to point B. This is where your Optical Light Source (OLS) and Optical Power Meter (OPM) come in. They work as a pair. The OLS injects a stable, continuous-wave light signal into one end of the fiber, and the OPM, waiting at the other end, measures exactly how much of that light made it through.
- Optical Light Source (OLS): This is your calibrated light generator. It's critical to match the OLS wavelength to the network's operating wavelength—most commonly 850 nm or 1300 nm for multimode and 1310 nm or 1550 nm for single-mode fiber.
- Optical Power Meter (OPM): This measures the absolute power of the light signal arriving at its detector. By comparing the power reading on the OPM to the known output power of the OLS, you get the total optical loss of the link, also known as attenuation.
When used together, these two tools are often called an Optical Loss Test Set (OLTS). An OLTS is the industry standard for performing Tier 1 certification, the baseline requirement for most projects.
The Detective for Link Characterization
When a simple pass/fail loss measurement isn't enough, you need to bring in the detective: the Optical Time-Domain Reflectometer (OTDR). The OTDR sends thousands of high-powered light pulses down the fiber and then listens for the faint reflections and backscattered light that return from every point along the cable. It uses this information to create a graphical trace—a detailed map of the entire fiber run.
From a single OTDR trace, you can determine:
- The precise length of the fiber.
- The location and performance (loss and reflectance) of every splice and connector.
- The exact location of faults like a sharp macrobend or a complete break.
- The overall attenuation coefficient (dB/km) of the fiber itself.
An OTDR doesn’t just tell you if a link failed; it tells you where it failed and why. For carrier routes, FTTx networks, or complex data center cabling, this level of insight is absolutely essential for both certification and troubleshooting.
Essential Tools for Visual Verification
Not every problem is a complex one. In fact, most fiber network failures are caused by something surprisingly simple, and you just need the right tools to see it.
Fiber Inspection Scope
By far, the number one cause of network failure is a dirty connector end-face. A tiny speck of dust, completely invisible to the naked eye, can block the fiber core and cause catastrophic signal loss and high reflectance. A fiber inspection scope is a specialized microscope that lets you see the end-face in high magnification, so you can verify it's perfectly clean before you ever mate it with another connector.
Visual Fault Locator (VFL)
A VFL is one of the simplest yet most valuable tools in your kit. It's essentially a high-powered red laser designed for fiber optics. When you inject its bright red light into a cable, the light is so intense that it becomes visible to the human eye right through the cable's jacket at a break, a bad splice, or a tight bend. This makes it perfect for quick continuity checks or finding the right fiber in a crowded patch panel.
Having this full suite of gear—from the detailed analysis of an OTDR to the straightforward simplicity of a VFL—ensures you're prepared for any scenario the field throws at you. It takes the guesswork out of the equation and turns testing into a methodical, repeatable process.
Getting Down to Business: Tier 1 Certification and Insertion Loss
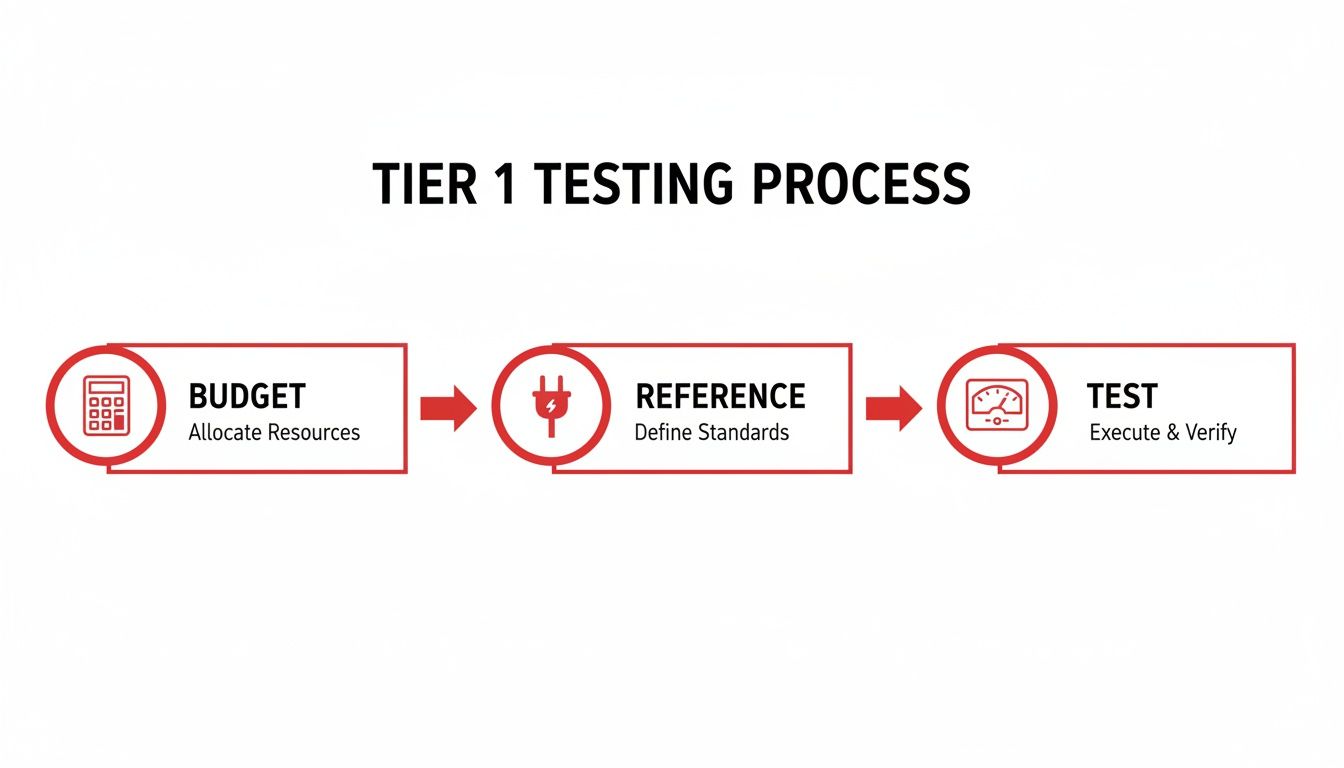
Alright, with your gear prepped and ready, it's time to tackle Tier 1 certification. This is the absolute foundation of fiber testing. We're essentially measuring insertion loss, which is just a technical way of saying we're measuring how much light gets lost from one end of the fiber to the other.
Think of it as a fundamental health check. It gives you a clear, straightforward pass or fail on the link's basic ability to carry a signal.
Before you can pass or fail a link, though, you need to know what the target is. We call this the loss budget. It's a calculated maximum amount of signal loss that a specific fiber run can tolerate. If you go over that budget, the link fails. Simple as that.
Calculating Your Link Loss Budget
Figuring out the loss budget isn't complicated. You're basically just adding up the expected loss from every single component in the path—the cable, the connectors, and any splices. This gives you a performance benchmark based on well-established industry standards.
The total budget is a sum of three key elements:
- Total Fiber Loss: The inherent signal loss over the length of the cable itself, measured in decibels per kilometer (dB/km).
- Total Connector Loss: Every time you connect two fibers, like at a patch panel, you lose a tiny bit of light. The TIA standard budgets a generous 0.75 dB for every mated pair.
- Total Splice Loss: Fusion or mechanical splices also introduce loss. A good fusion splice should be well under 0.3 dB.
These numbers aren't pulled out of thin air. They're tied directly to the physics of the fiber and the specific wavelengths of light being used. For instance, multimode fiber running an 850 nm signal typically loses about 3 dB per kilometer, but at 1300 nm, that drops to around 1 dB. Single-mode is usually tested at 1310 nm and 1550 nm, each with its own unique loss profile. These standards are the bedrock of our acceptance criteria, as you can see in guidelines from organizations like The Fiber Optic Association.
Let's walk through a real-world scenario. Say you have a 2 km single-mode link with two connector pairs and one fusion splice. Using TIA-568 standard values (0.4 dB/km for single-mode fiber), the math looks like this:
- Fiber Loss: 2 km * 0.4 dB/km = 0.8 dB
- Connector Loss: 2 pairs * 0.75 dB/pair = 1.5 dB
- Splice Loss: 1 splice * 0.3 dB/splice = 0.3 dB
- Total Loss Budget: 0.8 + 1.5 + 0.3 = 2.6 dB
If your OLTS measurement comes in at 2.6 dB or less, congratulations—that link passes Tier 1.
Getting a Solid Reference: The Key to Accurate Tests
Your loss measurement is only as good as your starting reference. Before you test anything, you must set a "zero" reference using your light source and power meter. This step essentially tells your equipment to ignore the loss from your own test jumpers, so you're only measuring the link itself.
There are three ways to do this, and picking the right one is crucial.
- One-Jumper Method: This is the one you'll use 99% of the time. You connect the source directly to the power meter with a single high-quality Test Reference Cord (TRC). This sets a clean zero point and ensures you measure the loss of the link and the critical connection at the far end.
- Two-Jumper Method: You might use this if your gear has a different connector type than the link you're testing. It works, but it has a major drawback: it "references out" the loss of one of the end-face connections, which can hide a potential problem.
- Three-Jumper Method: This is even less common and is typically reserved for links with fixed plugs on both ends instead of adapters. Like the two-jumper method, it's less accurate because it references out both end-face connections from the final measurement.
For almost every job you'll encounter in the field, the one-jumper reference is the gold standard. It gives you the most honest and accurate measurement of the entire link's performance, including the connectors where most faults happen. Stick to it unless the physical setup absolutely forces you to use another method.
The Critical Need for Bidirectional Testing
Here’s a rookie mistake that can cause major headaches down the road: testing a fiber link in only one direction. It might seem faster, but it can easily mask serious issues. Every major standard, including TIA-568, requires bidirectional testing for a link to be properly certified.
This means you first measure the loss from End A to End B, then you physically swap your light source and power meter and measure again from B to A.
Why go through the extra trouble? Imagine a scenario where someone accidentally spliced two different types of multimode fiber together, like OM3 and OM4.
- When you test in one direction, light might be traveling from the smaller fiber core to the larger one. This can result in a reading that looks acceptable, or sometimes even shows a bizarre "gain."
- But when you test from the other direction, the light tries to go from the larger core into the smaller one, causing a massive loss that will immediately show up on your meter.
Without testing both ways, this critical mismatch would go completely undetected until the network goes live and users start complaining about poor performance. By testing in both directions and averaging the results, you get the true, undeniable measurement of the link's health and ensure you're fully compliant with industry standards.
Mastering Tier 2 Diagnostics with OTDR Trace Analysis
While Tier 1 testing gives you that all-important pass/fail on total signal loss, Tier 2 is where you put on your detective hat. Using an Optical Time-Domain Reflectometer (OTDR), you're no longer just asking if a link is good, but where it's good, where it's bad, and most importantly, why. For certifying and troubleshooting anything beyond a simple patch cord, this level of detail is non-negotiable.
So how does it work? An OTDR sends a powerful, targeted pulse of light down the fiber. It then listens for the "echoes"—the tiny amount of light that naturally scatters back from the glass (Rayleigh backscattering) and the larger reflections that bounce back from connection points. By precisely timing how long it takes for these signals to return, the OTDR draws a graphical map, or "trace," of the entire fiber run, pinpointing every splice, connector, and fault along the way.
This visual map is the key to truly understanding the health of your fiber plant.
Before you jump into OTDR analysis, remember that it builds on the foundation of Tier 1 testing. You still need to know the basics of establishing a loss budget, setting a proper reference, and getting that initial insertion loss measurement.
Think of it this way: Tier 1 tells you the story has a bad ending (the link failed). Tier 2 lets you read every chapter to find the villain.
Decoding the OTDR Trace
An OTDR trace can look intimidating at first, but it's really just a story about the fiber's journey. Once you learn the language, you can read it fluently.
Here’s what you'll see and what it means:
- The Initial Pulse: This is the massive reflection from the OTDR's own connector. It's so bright it temporarily blinds the detector, creating a "dead zone" where you can't see events right next to the machine. This is why launch cables are so important.
- Fiber Span: A smooth, gently downward-sloping line is your best friend. This indicates a healthy stretch of fiber. The steepness of the slope tells you the attenuation rate (the loss in dB per kilometer).
- Reflective Events: See a sharp spike shooting upwards? That's almost always a connector pair. A tall spike is a red flag for a dirty or damaged end-face causing high reflectance, which can wreak havoc on high-speed networks.
- Non-Reflective Events: This is a sudden drop in the trace without a spike. It typically points to a fusion splice or a macrobend (a tight bend in the cable). A steep, sharp drop means you've found a high-loss splice that needs to be redone.
- The End of the Fiber: The trace will abruptly end with a large reflective spike that then dives into the "noise floor" at the bottom of the graph. This is the end of the line. If it shows up much sooner than you expected, you've found a clean break in the cable.
The real skill in Tier 2 testing is telling these signatures apart. It's how you can distinguish between a textbook fusion splice and a stress-induced macrobend hidden inside a conduit, all without leaving the patch panel.
Configuring Your OTDR for Accurate Results
You can't just plug in and hit "Auto Test" on every job and expect perfect results. The settings you choose directly impact the quality and accuracy of your trace. Two of the most critical parameters are pulse width and averaging time.
Pulse Width
This is the duration of the light pulse your OTDR fires into the fiber. It's a trade-off between resolution and range.
- Short Pulse Width (e.g., 5 nanoseconds): This gives you fantastic resolution, letting you see two events that are very close together. The downside? It sends less energy down the pipe, so it's only good for shorter runs, like inside a data center.
- Long Pulse Width (e.g., 100 nanoseconds): This injects a ton of energy, letting you see all the way to the end of a long-haul carrier route. The trade-off is that it creates a larger dead zone and can blur two closely-spaced events into one.
Averaging Time
This setting tells the OTDR how long to listen for the returning signals. A longer averaging time allows the device to take multiple measurements and average them together, effectively filtering out random noise. This produces a cleaner, smoother trace, but it also takes more time. For very long links or high-loss circuits, you'll need to be patient and let it run longer to get a reliable reading of the far end.
Putting It All Together: A Practical Scenario
Let's say you're testing a new 5 km FTTx drop. The Tier 1 test failed—the loss is way over budget. Time to bring in the OTDR.
You connect your OTDR with a proper launch cable and set a medium pulse width to get a good balance of distance and resolution. The trace pops up. For the first 2 km, you see a nice, smooth slope. But then, at the 2 km mark, there’s a sudden, non-reflective drop of 0.8 dB. Further down, at 4.5 km, you see a massive reflective spike.
From this one test, you can make two clear diagnoses:
- That 0.8 dB drop at 2 km is a shoddy fusion splice. A good splice should be under 0.3 dB, so this one is way out of spec.
- The huge reflection at 4.5 km is screaming "dirty connector!" It's likely a contaminated or poorly seated connection at a patch panel.
Instead of a vague "link failure," you now have an actionable plan. You can dispatch a tech directly to the splice enclosure near the 2 km mark to re-burn the splice and then have them inspect and clean the connector at the 4.5 km location. That’s the power of OTDR testing: it turns guesswork into a precise, surgical repair plan.
Turning Field Data into Actionable Reports
The job isn’t done when you pack up the OTDR. In many ways, the most important part is just getting started. All that raw data you've meticulously collected in the field is just a bunch of numbers until you translate it into a clear, professional report.
This report is more than just paperwork. For your client, it's the official proof that the installation meets spec and that they got exactly what they paid for. For you and your team, it becomes the permanent "birth certificate" for that fiber link—an invaluable baseline you'll reference for all future maintenance and troubleshooting.
Without a solid report, all your hard work in the field is incomplete and unverified. It’s the final step that transforms complex measurements into a simple, understandable record of network quality.
Crafting a Bulletproof Fiber Test Report
When you hand a report to a carrier or a data center manager, they’re looking for specific things. They need a complete, standardized picture of the link’s performance. Just exporting a default OTDR file and emailing it over won’t cut it. Your report needs to provide context and a clear summary that anyone can understand.
A truly comprehensive report always nails these core components:
- Project and Customer Information: Start with the basics—project name, client, test date, and the name of the technician who did the work.
- Link and Cable Identification: Be ruthlessly specific. Use clear identifiers like
BLD-A-IDF1_to_BLD-B-MDF2for the cable andBlue-01for the fiber strand. Vague labels here create massive headaches down the road. - Test Equipment Details: List the make, model, and serial number of the OTDR or OLTS. This is non-negotiable for validating results, as all test gear must have a current calibration certificate.
- Testing Parameters: You have to document the exact settings used, because they directly affect the outcome. This includes the test wavelengths (1310 nm / 1550 nm for single-mode), as well as the pulse width and averaging time for OTDR traces.
Think of this first section as the report's foundation. It establishes the who, what, where, and how, giving instant credibility to the technical data that follows.
Presenting the Technical Data
Once the administrative details are out of the way, it's time for the main event: the test results. This is the heart of the report, where you prove the link performs as expected against the standards and the loss budget you calculated earlier.
Organize this section logically, starting broad and then drilling down into the details.
Summary of Results
Lead with a clean, simple pass/fail summary table. This gives project managers and clients an immediate, at-a-glance verdict on the link's health without forcing them to wade through technical jargon.
| Measurement Type | Wavelength | Direction | Measured Value | Pass/Fail |
|---|---|---|---|---|
| Insertion Loss | 1310 nm | A -> B | 1.42 dB | Pass |
| Insertion Loss | 1550 nm | A -> B | 1.15 dB | Pass |
| Link Length (OTDR) | 1550 nm | A -> B | 3.10 km | Pass |
A well-structured summary is the most-read part of any test report. Make it easy for a network manager to sign off on the work by putting the most important information right at the top. The detailed data that follows is there to back it up.
Detailed Event Analysis
After the summary, you must include the full OTDR trace for each tested wavelength. Good reporting software will embed these graphical traces directly into the PDF. Right next to the trace, include a detailed event table that breaks down every single connector, splice, and anomaly the OTDR found.
That table needs to show:
- Event Number: A sequential number for each event along the fiber.
- Distance: The precise location of the event from the OTDR.
- Loss (dB): The signal loss caused by that specific event.
- Reflectance (dB): How much light is being reflected back by the event.
- Cumulative Loss (dB): The running total of loss up to that point in the fiber.
This granular breakdown is what a field tech will depend on five years from now when they're sent to troubleshoot a problem on this exact link. It provides the actionable data they need to find a fault with surgical precision. This isn’t just a report; it’s a long-term operational asset.
Frequently Asked Questions About Fiber Optic Testing
No matter how many times you run these tests, certain questions always seem to pop up on the job. Let's tackle some of the most common things technicians and project managers ask about testing fiber optic cable.
Think of this as your go-to cheat sheet for when you're in the field and need a straight answer on a tricky point. We'll clear up some common confusion and share insights that can only come from years of experience.
What Is The Difference Between Tier 1 And Tier 2 Testing?
This is probably the most fundamental question we get, and it's a crucial one. These two tiers aren't interchangeable; they represent different levels of detail and work together to give you the full picture of a network's health.
-
Tier 1 (OLTS Testing): This is your basic certification. You use an Optical Loss Test Set (OLTS) to get a hard number on the total signal loss, or attenuation, from one end of the link to the other. It's a straightforward pass/fail result based on the loss budget you've calculated.
-
Tier 2 (OTDR Testing): This is where you get into the diagnostics. An Optical Time-Domain Reflectometer (OTDR) doesn't just give you a number; it draws you a map. It shows you the location and performance of every single component—every splice, every connector, and any faults along the way.
In short, Tier 1 tells you if the link is good, while Tier 2 tells you why it's good or bad. For any serious project, you absolutely need both.
Industry standards are clear: every fiber needs to be tested after installation to prove its integrity. Tier 1 testing with an OLTS measures the total light loss, but the more advanced Tier 2 testing, which adds an OTDR trace, is what provides the complete performance story. You can get a great visual breakdown of these standard testing methodologies and see where each one fits in.
Why Do I Need A Launch Cable For OTDR Testing?
I see this mistake all the time: trying to use an OTDR without a launch cable. It’s a critical error that completely invalidates your results for the first connection.
A launch cable is simply a long spool of fiber, usually between 150 meters and 1 kilometer, that you connect between the OTDR and the link you're testing. Its whole job is to deal with the OTDR's "dead zone."
That initial blast of light from the OTDR is so intense that it temporarily saturates the machine's detector. This creates a blind spot where it can't measure anything. Without a launch cable, that blind spot falls right on the first connector of your link—a common point of failure—making it impossible to see its performance. The launch cable effectively pushes that dead zone onto itself, allowing the OTDR a clear view of that all-important first connection.
Can I Skip Inspecting Connectors If They Are Brand New?
Absolutely not. This is a tempting but dangerous shortcut that causes countless network problems down the line.
Just because a connector is fresh out of the bag doesn't mean it's clean. It could have dust, residue from the protective cap, or oils from the person who handled it last.
If you plug in a dirty connector, even just once, you can cause permanent damage to the end-faces on both sides of the connection. That leads to high loss, bad reflectance, and a world of headaches. The "inspect before you connect" rule isn't just a suggestion; it applies every single time. It takes five seconds and is the single best thing you can do to prevent the #1 cause of network failures.
For anyone looking to document these kinds of critical procedures for their own teams, looking into best practices for creating interactive step-by-step guides can be a huge help in ensuring consistency.
At Southern Tier Resources, we understand that reliable networks are built on a foundation of meticulous engineering and flawless execution. Our teams specialize in end-to-end fiber optic infrastructure, from initial design and construction to expert splicing, testing, and certification. We deliver the detailed documentation and proven performance your network demands. Partner with us to ensure your infrastructure is built right, tested right, and ready for the future. Learn more at https://southerntierresources.com.