The most popular advice on business case development is to lead with the return. Put a strong NPV on page one, show a short payback, and funding will follow. Approvers don't work that way. They've funded profitable looking fiber, wireless, and data center builds that arrived late, cost more than planned, and never delivered the promised take rate.
I would start from the opposite end. Build a case that survives challenge on its baseline, its dates, and its record keeping after handover. If those three hold, the return becomes believable.
Why Approvers Reject Business Cases That Look Profitable
A positive headline return is the easiest part of a draft to produce. Move one assumption, lower the unit cost, pull the energization date forward, or assume a faster revenue ramp, and the model turns green. Reviewers know this, so they don't start with your return. They start by testing whether the inputs behind it can be trusted.
Experience justifies the skepticism. Large infrastructure programs overrun on cost and schedule often enough that seasoned approvers treat an untested estimate as optimistic until the evidence says otherwise. The drivers are consistent across fiber, wireless, and data center builds: quantities grow during design, permits arrive late, power and interconnection dates slip, and utilization ramps slower than the sales case assumed. Each of those is a financial variable, not a scheduling detail. A slipped energization date moves NPV as surely as a price increase does, yet weak cases bury it in a schedule appendix instead of modeling it.
Three Questions Hiding Behind One Decision
Approvers separate three decisions that weak drafts merge into one. First, is the strategic need real, measured against current capacity, backlogs, or outage exposure? Second, is the proposed technical and commercial solution better than the alternatives, including doing less? Third, can your organization execute it inside its funding and risk limits with the crews, permits, and power available?
A draft can pass the first question and fail the other two. Say a county network needs more middle mile capacity. That doesn't prove a single large build beats a phased build, and it doesn't prove the make ready workload fits the funding window.
Approvers also price what the project leaves behind. Maintainability and complete as-built records determine operating cost after handover and become the reference data for your next estimate, so they belong in the case as returns, not afterthoughts. Benefits get the same treatment in the public sector, where the UK Government Digital Service guidance on measuring service benefits expects outcomes to be defined, owned, and measurable rather than asserted in a spreadsheet.
The First Three Checks Reviewers Run
- Reference class comparison: Compare unit costs, splice productivity, and schedule durations against similar completed projects, not against your own optimistic plan.
- Explicit contingency: Show the allowance as its own line tied to named risks. A hidden contingency makes reviewers assume the rest of the estimate is padded too.
- Independent challenge of the preferred option: Have someone outside the project team argue for the runner up option using the same evidence. If the preferred option only wins under its own assumptions, it isn't ready.
Self test: Name the baseline, name each benefit owner, and state the single assumption that would kill the project if it proved wrong. A draft that can't answer all three in one minute isn't ready for approval.
Test uncomfortable scenarios before the review meeting does it for you. Demand arriving later than forecast, make ready scope expanding, labor productivity falling, or utilization ramping slowly will change the answer more than small changes in material prices. I would rather defend a case that admits its fragile assumption than one that hides it. Disciplined challenge isn't administrative overhead. It's your control against predictable optimism bias.
Structure the Case with the Five-Case Model
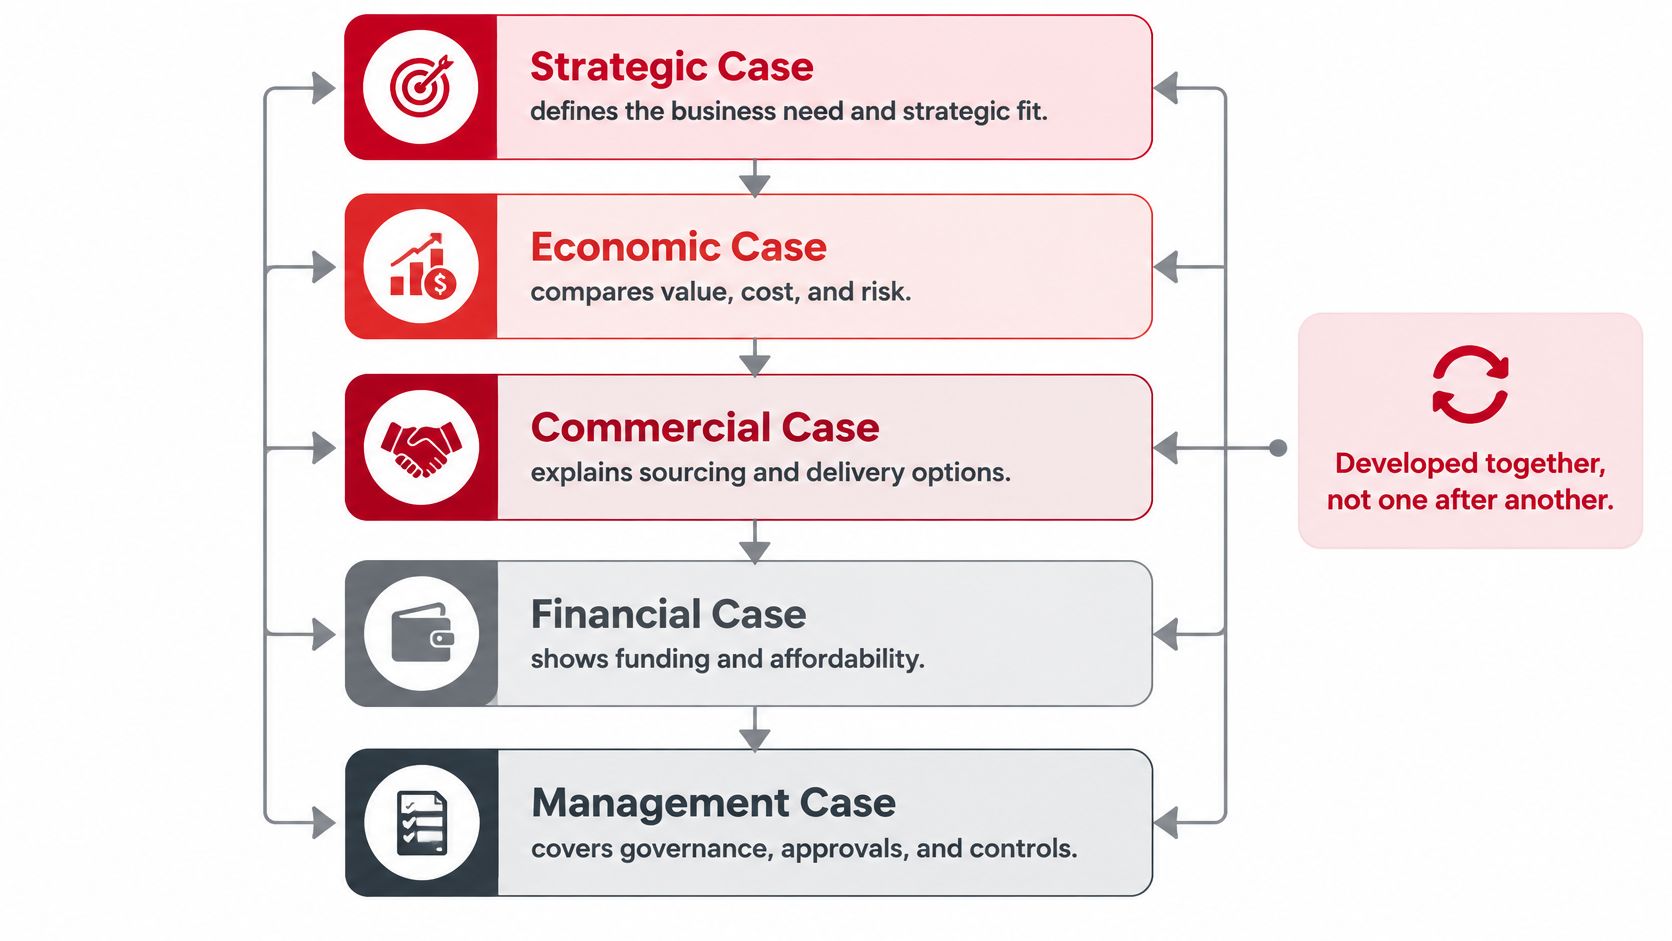
The following diagram shows the five cases as connected layers rather than sequential chapters.
A strong case is an iterative, evidence-based sequence, not a single spreadsheet with narrative wrapped around it. You quantify the business as usual baseline, set SMART objectives, document the causal logic between operational changes and measurable outcomes, longlist feasible alternatives, screen them against critical success factors, then appraise a shortlist in detail. The detailed method for the baseline and benefits steps follows in the mapping section below.
That sequence matters because the common failure mode is choosing a technically attractive solution first. Teams fall in love with a route, a vendor, or a facility design before proving the need, the counterfactual, affordability, and delivery capacity. By the time finance asks what happens if you do less, nobody wants to rebuild the analysis.
Build a Real Longlist
For a telecom or data center proposal, your alternatives should normally include a do minimum case, a phased deployment, technology variants, and different delivery or contracting models. Say you're appraising a regional fiber build. Do minimum might mean upgrading existing copper plant and adding capacity only where failures are concentrated. A phased option builds the densest routes first, where pre sales are strongest, and defers sparse routes until anchor tenants sign. A technology variant might compare buried fiber against aerial construction on poles you don't control.
Those options produce very different cash flow shapes even when the final asset looks similar. That's the point. You're comparing risk and timing, not just end states.
The shortlist then gets assessed across five linked dimensions, strategic fit, economic value, commercial achievability, financial affordability, and management readiness. The UK government's Green Book identifies this Five Case Model and explicitly recommends developing the cases together, refining each as evidence and risks change.
The Five Cases and What Each Must Prove
| Case | Question it answers | Evidence to include | Common gap |
|---|---|---|---|
| Strategic case | Is the need real and tied to an objective? | Baseline metrics and SMART objectives | No quantified business as usual baseline |
| Economic case | Is the preferred option the best value? | Options appraisal, NPV and sensitivity results | Options not longlisted or shortlisted properly |
| Commercial case | Can the market deliver on these terms? | Procurement routes, risk allocation and contract terms | Risk left with the buyer by default |
| Financial case | Can we afford it and fund it over time? | Capex, opex, cash flow and funding source | Capex phasing not matched to the revenue ramp |
| Management case | Can we deliver and realize the benefits? | Delivery plan, governance and benefit owners | No named owner for each benefit |
Developing them together changes how you work. When the commercial case reveals that pole owners won't accept your proposed risk allocation, the economic case needs a new make ready allowance the same week, not after the document is finished. When finance caps annual spend, the phased option may beat the technically superior single build.
Finish with a practical artifact, a one page map showing which evidence sits in which case. Reviewers use it to find gaps quickly, and so will you. If a piece of evidence has no case to live in, it probably doesn't support the decision.
How to Map Baseline, Benefits and Deliverables
This map links what you build to what changes in the business.
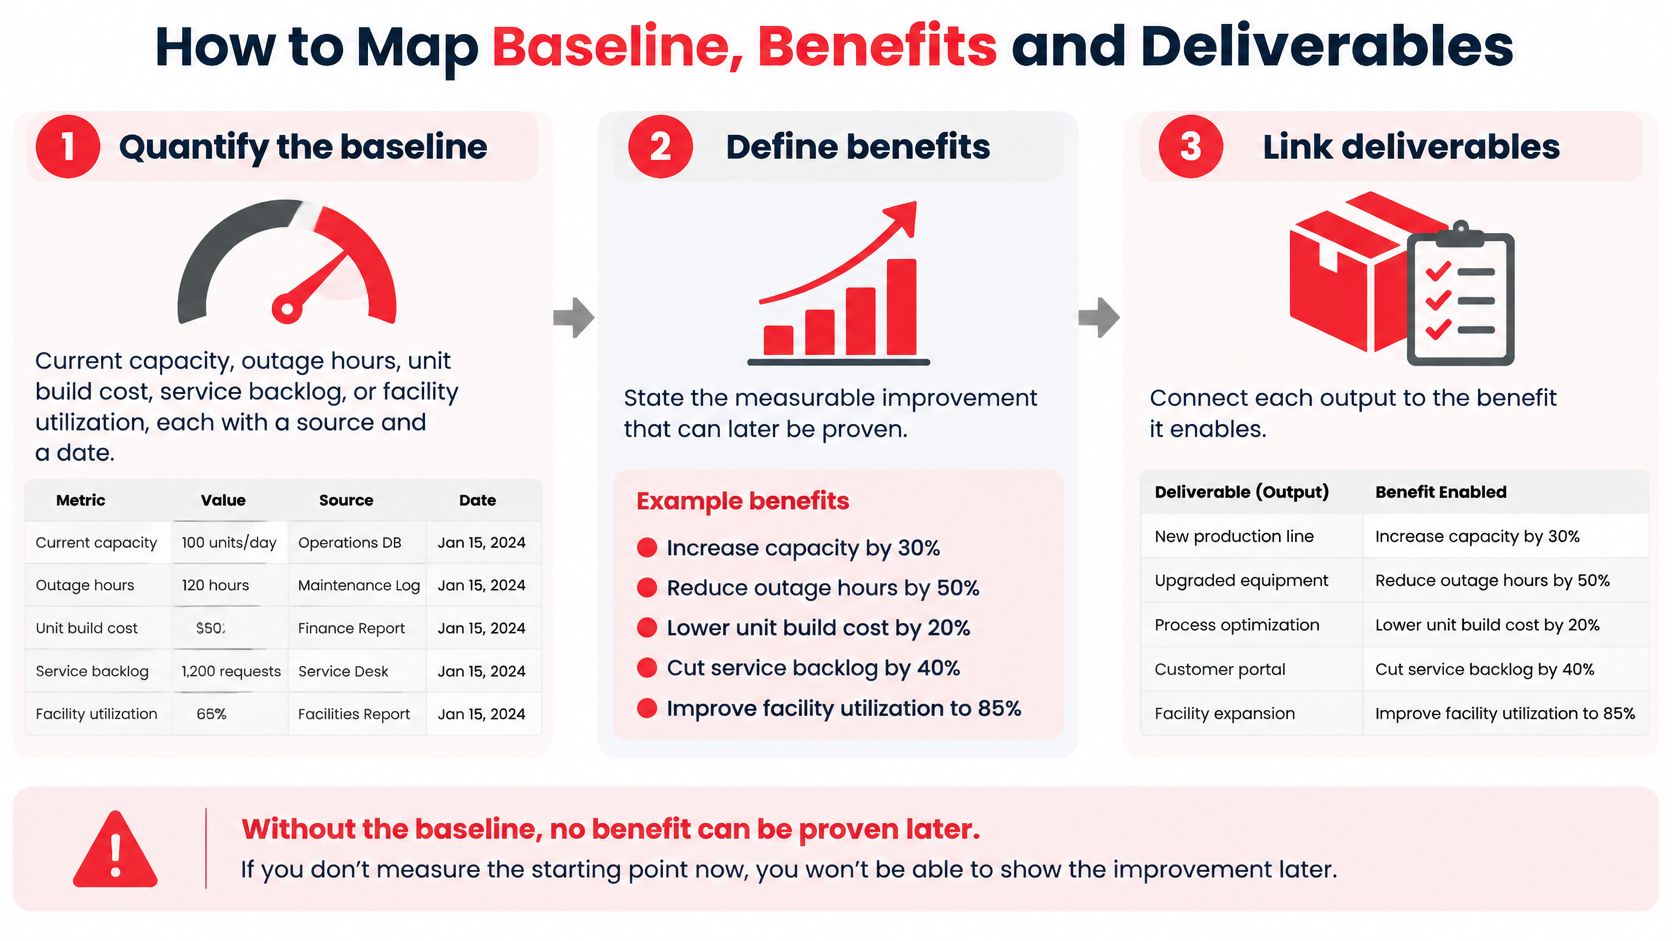
A business case is an investment allocation argument linking objectives to options, costs, benefits, risks, delivery arrangements, and measurable outcomes. The working method is to fix a baseline before the project begins, then build a benefits map that connects enabling changes and deliverables to intermediate and end benefits. Work through the steps in order, because each one depends on the quality of the last.
The Mapping Steps
Quantify the baseline. Record current capacity, outage hours, unit build cost, service backlog, or facility utilization, each with a source and a date. Where power or interconnection drives the schedule, record the utility's current lead time as a dated number as well; finance will test that figure first. Without a baseline, no later improvement can be proven. The common slip is using an undated average from a slide deck.
Define the strategic objective as a SMART target. Name the measurable result, the deadline, and the population it covers. "Improve broadband coverage" can't be tested. A target tied to passed locations in service by a stated date can.
Identify end benefits. These are business outcomes such as subscriber growth, improved reliability, lower operating cost, or faster revenue recognition. Don't list construction outputs here. That's the most frequent error in infrastructure drafts.
Identify intermediate benefits. These sit between the build and the money, such as faster service activation, higher make ready throughput, or fewer failed installations. They show reviewers the causal path instead of asking them to trust a leap.
Specify enabling changes. List what must change operationally, such as crew agreements, design standards, pre cleared permits, or new test and acceptance procedures. Include as-built documentation standards here; a benefit like lower repair cost only arrives if records are accurate enough for crews to act on. Deliverables alone don't produce benefits if crews and systems keep working the old way.
List tangible deliverables. Route miles, splice counts, cabinet installations, or data center connectivity belong here. Consider a segment that delivers 40 route miles and 1,200 splices. Those are outputs. Fewer repair dispatches on those routes is a benefit, and it only starts once the routes are accepted and in service.
Assign an owner and timing to each benefit. Every benefit needs a named person who will report actuals against forecast, plus a start date tied to a deliverable's acceptance rather than to project close. Unowned benefits disappear from post investment reviews.
Run the trace test before costing anything. Every benefit should trace back through an enabling change to a deliverable and to a measured baseline. Breaks in that chain are where approvers find invented value.
Keep Outputs and Outcomes Separate
This distinction protects your operating budget later. If the case promises lower operating cost, identify which cost line falls, when, and who controls it. Timing is a financial variable, not a footnote: a saving that begins when a route is energized is worth less than one that begins at acceptance, so put the energization or interconnection date on the benefit itself, not only on the schedule. Teams managing tight technology budgets can use practical budget guidance for IT leaders to check whether claimed savings are cash releasing or staff time shifted elsewhere.
Document the assumptions behind demand, productivity, schedule, power availability, and risk forecasts alongside the map. The discipline that matters isn't approval of the initial budget. It's baseline versus forecast versus actual measurement, repeated after testing and during live operation, so the organization learns which assumptions were wrong.
How to Build a Risk-Adjusted ROI and NPV Model
The benefits register is the discipline that separates credible cases from narrative ones. A spreadsheet total means little if nobody can explain where each benefit comes from, when it arrives, or how it will be verified. Build the register first, then let the financial model consume it.
The analyst view below captures where most modeling time should go, testing assumptions rather than polishing totals.

Start With the Benefits Register
For each benefit, record the owner, baseline, formula, timing, dependency, verification method, and confidence rating. A formula forces honesty. "Reduced truck rolls" becomes avoided dispatches per month multiplied by fully loaded cost per dispatch, starting only after the relevant route is accepted and records are loaded into your systems. A confidence rating forces a conversation about evidence quality before finance forces it for you.
Keep that register separate from the risk adjusted cost model. Costs need their own lines for labor productivity, permitting, make ready, materials, escalation, contingency, schedule delay, and operations. Mixing benefits and costs in one undifferentiated worksheet hides double counting and makes independent review painful.
Compare every option against a clearly defined business as usual counterfactual. Separate gross benefits from additional benefits the project itself causes. If subscriber growth would happen anyway on upgraded legacy plant, only the incremental growth belongs to the fiber option. Approvers look hard at this boundary because inflating additionality inflates every return metric downstream.
Why a Single NPV Isn't Enough
A single NPV or payback figure hides the shape of the risk. Two options can share the same base case NPV while one collapses under a modest demand shortfall and the other stays positive. Run low, base, and high scenarios on the variables most likely to change the decision, not on every line in the model.
Sensitivity Variables to Test Before Approval
| Variable | Why it moves the decision | How to test it | Source for the range |
|---|---|---|---|
| Take-rate or contracted revenue | Drives payback on each route or site | Low, base and high take-rate cases | Signed letters of intent and pre-sales data |
| Route miles or cabinet count | Sets capex and construction duration | Add make-ready and rework allowance | Field survey and GIS data |
| Splice or installation productivity | Drives labor cost and schedule | Low, base and high crew output cases | Past crew logs and productivity records |
| Energization or service-ready date | Sets lost revenue for each month of delay | Probability-weighted commissioning dates | Utility and permit schedules |
| Outage reduction | Sets the value of avoided downtime | Avoided restoration hours multiplied by cost per hour | Incident history and outage logs |
| Construction duration | Affects financing cost and opportunity cost | Best and worst case schedules | Past project actuals |
Work one example all the way through. Say a route's payback flips from positive to negative when take rate falls by a modest amount, while it stays positive across every realistic splice productivity range. Take rate is now your decision flipping variable. That tells the team where to spend effort, securing signed commitments and pre sales evidence rather than refining crew cost estimates to another decimal place.
It also tells you what approvers will interrogate first. Walk in ready with the evidence behind that variable, the range you tested, and the trigger at which you'd phase or stop the build. A phased commitment tied to contracted revenue often funds more easily than a single unconditional approval.
Reporting rule: Present NPV and payback alongside the variable that flips the decision and the probability you assign to that variable failing. Four numbers give approvers a decision. One number gives them a target to distrust.
Document who owns each assumption and when it gets retested. Material prices, permit timelines, and customer commitments move during appraisal itself. A model with dated inputs and named owners can be updated without rebuilding the whole case.
Stress-Test Schedule, Permitting and Power Dates
Most drafts treat delivery dates as fixed facts. For data centers and network builds that depend on utility power, that assumption is the most expensive fiction in the document. Energization, interconnection, and permitting dates belong inside the financial model, priced as variables with ranges and probabilities.
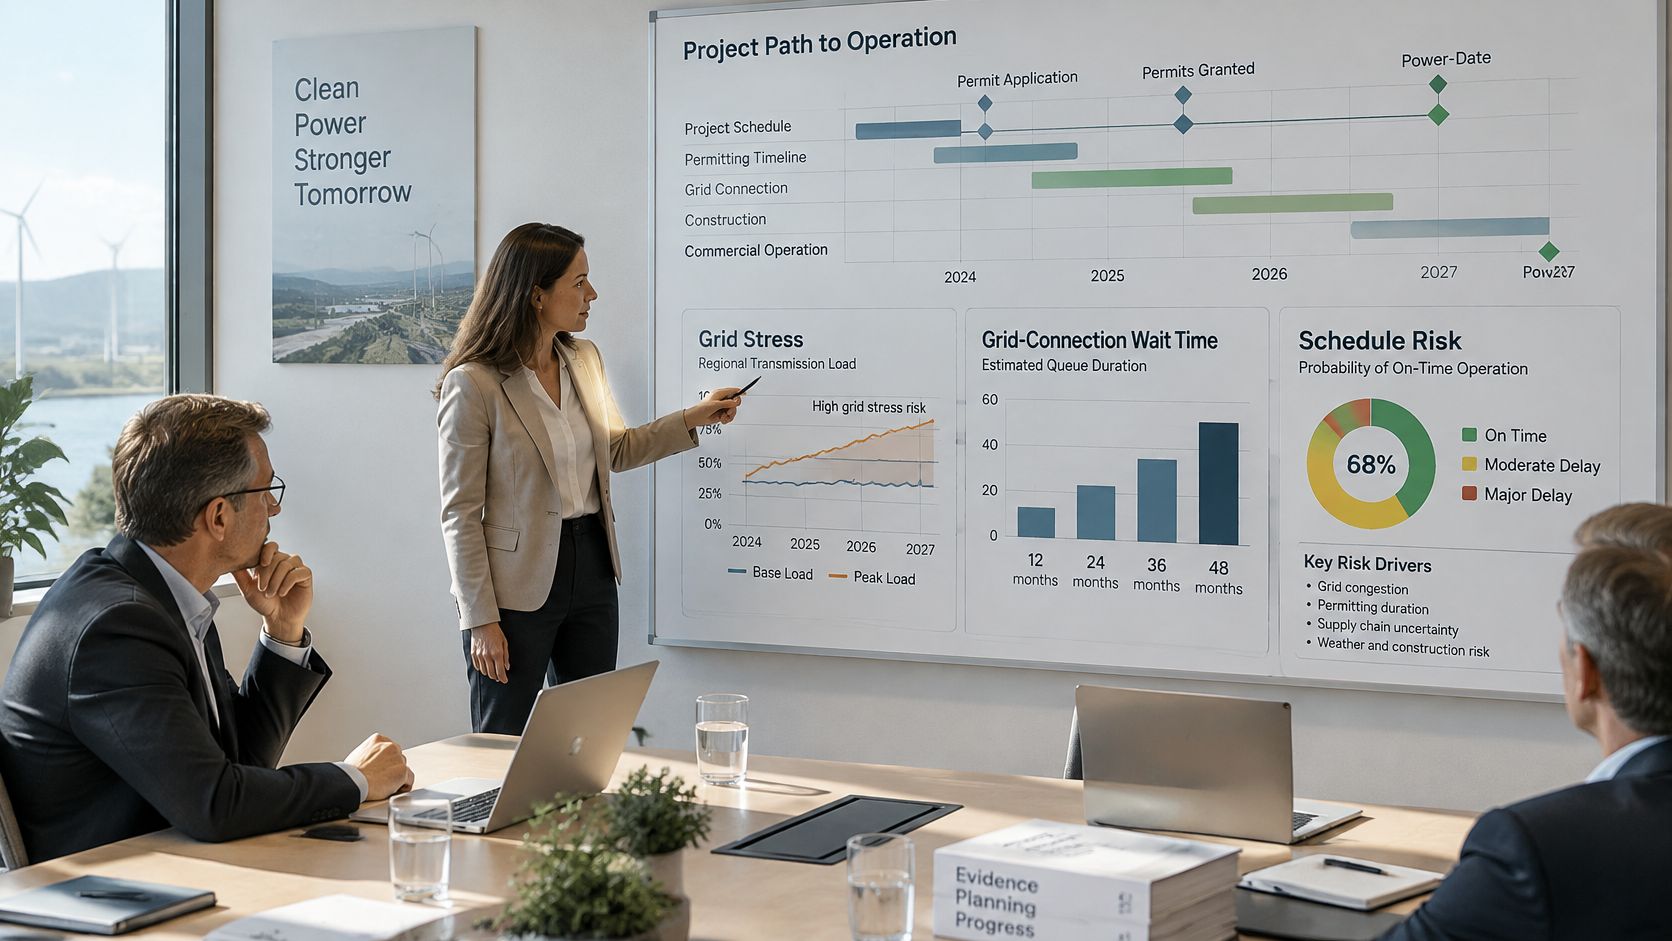
A 2025 Deloitte survey of 120 U.S. power and data-center executives identified grid stress as the leading development challenge, some grid-connection requests face waits of up to seven years, and 67% of respondents identified funding as important to closing infrastructure gaps, according to Deloitte's data center infrastructure analysis. Utilities and project sponsors routinely forecast different energization dates for the same site. The utility's date is usually the later one.
That gap overturns the cheapest-build instinct. A slightly more expensive design with earlier energization, phased capacity, an alternate interconnection, or stronger permitting readiness can carry higher risk-adjusted value than the lowest construction bid. An alternate feed also buys schedule resilience: if the primary interconnection slips, the asset still earns. The cheapest asset that cannot enter service earns nothing.
Model Delay in Money, Not Months
- Quantify value at risk per month. Monthly lost revenue, contractual penalties, extended financing, and churn exposure give you a delay cost rate.
- Build probability-weighted commissioning scenarios. Weight early, expected, and late service dates, then calculate expected lost revenue as probability multiplied by months delayed multiplied by the monthly delay cost.
- Separate ready for construction from ready for service. A completed building without power, fiber, or commissioning is not revenue-ready.
Watch this walkthrough of schedule risk before locking your commissioning assumptions.
Test each dependency that can move the service date: make-ready completion, fiber route availability, substation access, temporary power, and commissioning sequence. Then work one slip scenario through the arithmetic. Take your monthly delay cost rate, assign a probability to a six-month utility slip, and the expected loss, rate times months times probability, can exceed the entire saving from a cheaper electrical design. Phased energization changes that math too: early capacity starts earning while later phases wait, and it puts as-built records and maintainable plant in operations' hands sooner, which has its own value downstream.
Use a clear decision rule. If expected delay losses exceed the premium for earlier or phased energization, pay the premium or phase the capacity. If no design fixes the date, rescope the site or test relocation and modular deployment in the options appraisal.
Map Stakeholders and Approval Checkpoints
Stakeholder mapping fails when it lists names without decisions. Map who can block funding, delay a permit, withhold power, or refuse to own a benefit. Those are the people your case has to satisfy, in the order their gates occur.
Build the Stakeholder Map
List the executive sponsor, finance, the utility, permitting agencies, operations, anchor customers or tenants, and the contractor. For each group, rate influence and interest, record what it must approve, and write down the objection it will most likely raise. Operations will ask who maintains new plant with current headcount, so answer with your maintainability choices and complete as-built records, because both cut fault isolation time and rework cost after handover. Anchor tenants will ask what happens to their service date if energization slips. The utility will want a named owner chasing its study results and queue position, since those dates are revenue variables, not schedule trivia. Write the answers before the meeting.
The map also needs a rule for which decisions get formal sign-off and which get routine review. The risk thresholds for spreadsheet replacement approval framework draws that line for a smaller operational change, and the same test scales upward: low-risk calls stay with the working team, and anything that can move cost, schedule or revenue gets a named approver.
Order the Checkpoints and Tie Risks to Money
Sequence your gates in the order each one releases the next, and mark which gate sits on the critical path to energization. Permitting and interconnection often run in parallel but answer to different authorities, so a slip in one does not excuse silence in the others. A gate without defined evidence becomes a meeting where opinions compete.
Then build a risk register that feeds the model instead of sitting in an appendix. For each risk, record likelihood, lost revenue or cost per month of delay, owner, mitigation, and the trigger that shows the risk is happening. Say a permit appeal carries a three month delay exposure. Price it at your delay cost rate and carry the range into the sensitivity analysis.
Finish with a consistency sweep. Every material risk in the register should appear in the sensitivity model, and every sensitive variable should have a named owner in the register. Approvers fund a case where the narrative, the risks and the numbers describe the same project.
Choose a Delivery Model Your Budget Can Survive
Your contract model decides who carries cost overrun risk, so choose it before you finalize contingency. A strong economic case built on the wrong delivery model will unravel during procurement.
Approval Checkpoints and What Each Reviewer Tests
| Checkpoint | Owner | Evidence required | Reviewer question |
|---|---|---|---|
| Baseline sign-off | Data owner | Dated source metrics | Is every number traceable to a source? |
| Utility interconnection study | Utility engineer | Study results and queue position | Is the power date probability-weighted? |
| Permit and easement approval | Permitting lead | Filed applications and agency response dates | Which approval gates energization? |
| Finance review | Finance lead | NPV, payback and sensitivity results | Does the decision flip under the low case? |
| Executive sponsorship | Sponsor | Named benefit owners and funding limit | Does the plan respect the funding limit? |
Use those gates to compare fixed price, unit rate, time and materials, and performance based models against your risk profile. Fixed price suits well defined scope with completed surveys, and its trap is change orders when field conditions differ. Unit rate suits repetitive fiber construction where quantities flex, and its trap is weak quantity verification. Time and materials suits uncertain restoration or make ready work, and its trap is open ended spend without productivity controls. Performance based terms suit measurable service outcomes, and its trap is disputed measurement.
Price the Lifecycle, Not Just the Bid
Compare three scenarios side by side, the lowest initial bid, a reliability optimized design, and a maintainability optimized design. Value restoration hours avoided, accurate splice and test records, standardized acceptance data, spare pathways, remote monitoring, and cross trained crews as investable returns. Outage avoidance doesn't create new revenue, but it protects revenue, deployment velocity, and safety.
Accurate as-built plans and test records matter after handover because every repair, audit, insurance review, or capacity upgrade depends on them. Say a municipal fiber build accepts a cheaper bid with thin documentation. Crews can't trust splice locations, repeat site visits multiply, and mean time to repair stays high for years. The bid saving evaporates while the asset still has decades of life left.
Put three questions to every bidder. How is acceptance data delivered and in what format? Who owns the as built record and updates it after changes? What restoration target does the design assume, and what evidence supports it? Weak answers here are pricing information. They're telling you where your future operating costs live.
Submit a Case Your Approvers Can Fund
Don't submit until the case passes a pre submission gate, even if a funding deadline is pressing. A rejected case loses more time than a short delay to fix evidence.
Run five checks in order. First, the baseline is signed off by the people who own the data, with a source and date on every metric. Second, every benefit has a named owner, timing, and verification method. Third, the sensitivity analysis names the single variable that flips the decision and the probability assigned to its failure. Fourth, schedule and energization scenarios are probability weighted, with ready for construction and ready for service dates shown separately. Fifth, the contract model is chosen and its risk allocation is written out, including who owns the as built record.
If any check fails, return to the step that owns it rather than adjusting the model to fit the result. Before locking the financial model, validate the engineering, make ready, and permitting assumptions with the delivery team and reviewers who will test them. Our end to end services, from design to deployment and maintenance, and our Data Center Solutions infrastructure fit out for data centers and hyperscale cloud providers mean those delivery assumptions can be checked with one accountable team, reachable at (469) 405-4671.
The case is fundable because its baseline, benefits, and risks each trace to evidence and a named owner.
Before you lock your next business case, validate its engineering, make ready, permitting, and as built documentation assumptions with a delivery partner that handles design, deployment, and maintenance as one accountable scope. Visit Southern Tier Resources to discuss your fiber, wireless, or data center build and turn a tested case into a funded, buildable project.