At 3 a.m., the NOC sees alarms from a regional aggregation ring. A backhoe has cut one fiber route, and the supposedly diverse backup is dark too because both paths share a bridge crossing and a common conduit. The escalation list points to a carrier contact who left months ago, the splice crew needs site access, and the data-center operator is asking for an accurate restoration estimate that nobody can provide.
That situation exposes the difference between a continuity document and business continuity strategies that work under pressure. In telecom and data centers, resilience depends on physical routes, power transfer, vendor hand-offs, traffic engineering, field logistics, and practiced decisions. ISO 22301 provides a common management framework, but crews still have to locate the fault, obtain permits, splice the cable, transfer loads, validate service, and communicate with customers.
Why Business Continuity Strategies Matter for Network Operators
Downtime has a direct financial consequence, and the cost rises quickly for organizations that depend on continuous connectivity. Independent industry data places the average cost of an unplanned outage at $14,056 per minute. The same industry summary reports that more than 90% of mid-to-large enterprises lose more than $300,000 per hour, while 41% report losses between $1 million and $5 million per hour during outages. For smaller firms, one hour of downtime is estimated at about $10,000, and some mid-sized organizations can exceed $25,000 per hour. These figures are documented by Revenue Memo's business continuity statistics.
The practical implication is straightforward. A continuity program isn't an insurance document stored for an audit. It's an operating system for preserving essential services when a fiber span, power feed, cooling plant, carrier, or control platform fails.
What operators are actually protecting
A useful definition of continuity is the ability to design, test, and run recovery arrangements that survive a real incident. That includes the physical plant and the people who operate it.
A plan should answer questions such as:
- Route failure: Which circuits can reroute automatically, and which require NOC intervention?
- Field response: Which splicing crew or tower crew is authorized to mobilize, and who can provide access?
- Power disruption: Which loads transfer automatically, and which depend on a technician or utility vendor?
- Customer communication: Who issues the first notice, who approves the restoration estimate, and how are updates distributed?
- Cross-carrier recovery: Which interconnects, reciprocal arrangements, or temporary capacity options are available?
Documented downtime costs by infrastructure type
| Infrastructure Type | Avg. Cost per Hour | Avg. Cost per Minute | Typical Actual Recovery Time |
|---|---|---|---|
| Unplanned organizational outage | More than $300,000 for most mid-to-large enterprises | $14,056 average | Service-specific |
| Large enterprise outage | $1 million to $5 million for 41% of reporting organizations | Not separately reported | Service-specific |
| Smaller firm outage | About $10,000 | Not separately reported | Service-specific |
| Mid-sized organization outage | More than $25,000 in some cases | Not separately reported | Service-specific |
The table shows why redundancy alone isn't enough. A second path that shares a manhole, bridge, utility corridor, vendor, or restoration crew may fail from the same event. A recovery procedure that looks complete in PowerPoint may still collapse when nobody has rehearsed the hand-off between the NOC, carrier, field crew, and customer.
Smaller operators can use the practical guidance in this BC/DR plan for small businesses as a starting point, then extend it to cover network maps, plant dependencies, and field restoration. The strongest business continuity strategies connect governance language to the exact actions required at the rack, cabinet, tower, splice case, and meet-me room.
Risk Assessment and Business Impact Analysis for Critical Infrastructure
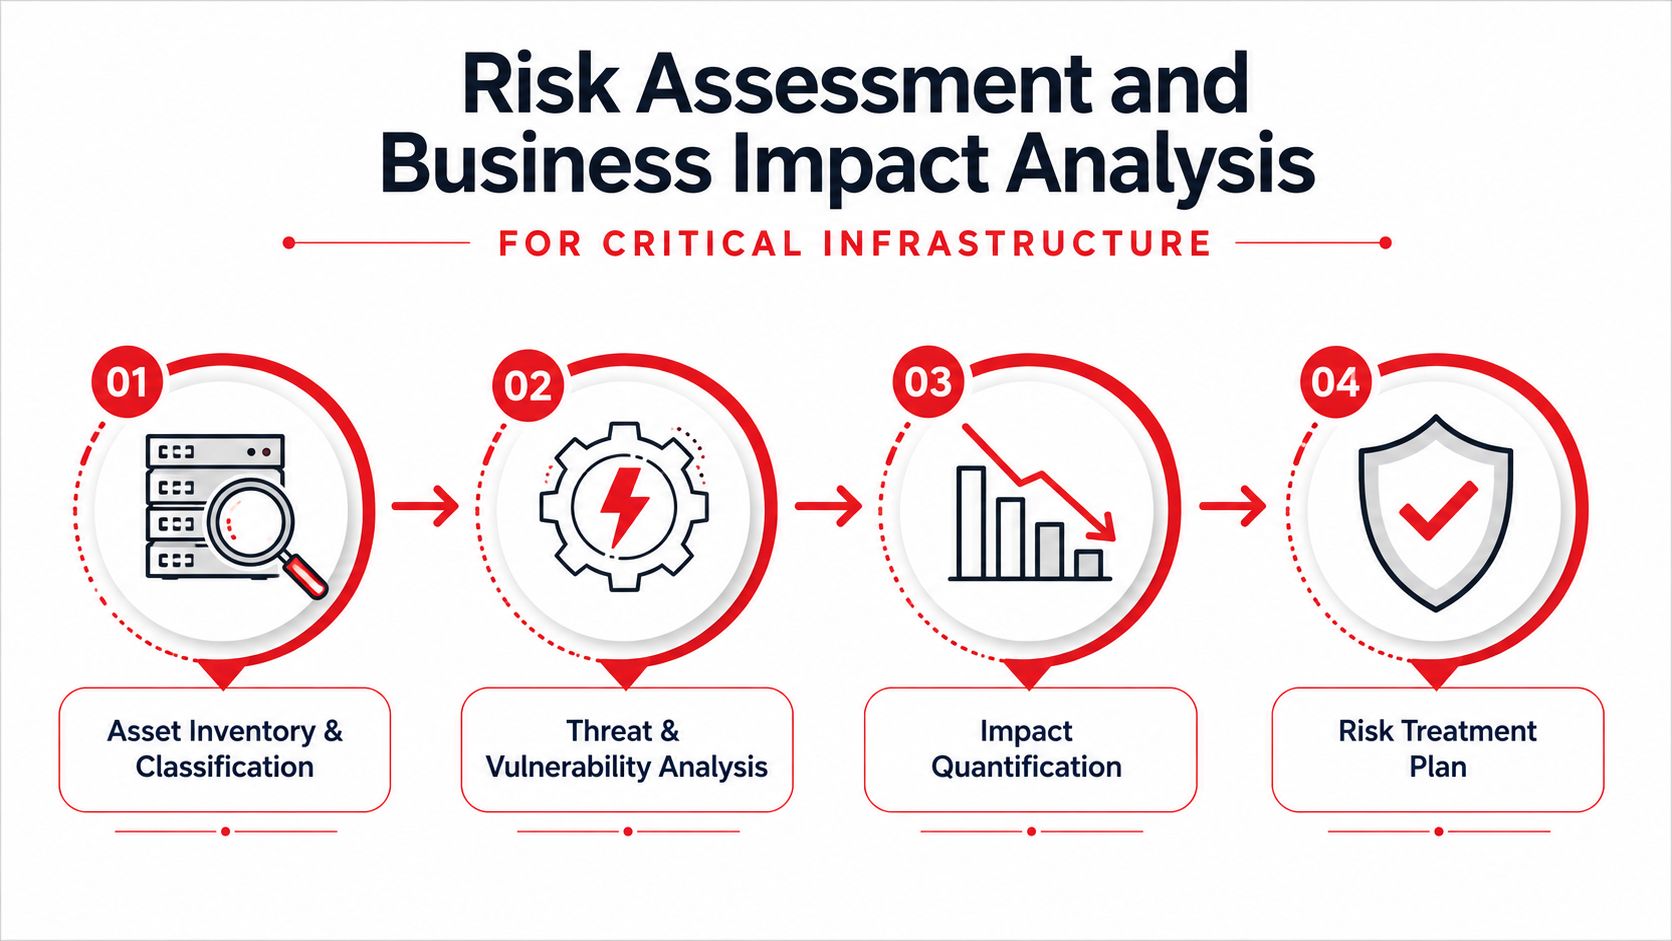
A useful risk assessment starts with an inventory that matches the granularity of the infrastructure. “Network” is too broad to support a defensible recovery decision. Record the fiber span, splice point, conduit route, bridge crossing, microwave link, tower, power feed, cooling plant, core switch, transformer yard, and building entry point as separate assets where their failure modes differ.
Build the analysis around service impact
For each asset, identify the services it supports, the customers affected, the people authorized to respond, and the dependencies required for restoration. A metro aggregation ring may depend on power at several huts, access agreements, transport permits, a third-party backhaul provider, and a routing policy that isn't documented in the same system as the physical plant.
Then set two service-specific recovery constraints:
- Recovery Time Objective, or RTO: the time within which a product, service, or activity must resume.
- Recovery Point Objective, or RPO: the point to which information must be restored, representing the maximum data loss the service can tolerate.
These definitions come from ISO terminology summarized in Riskonnect's RTO and RPO guidance. In a carrier environment, an RTO may be short enough for Layer 3 traffic rerouting but too short for physical restoration. That distinction matters. If a fiber cut requires dispatch, excavation, and splicing, the immediate strategy may be route diversity or a pre-engineered alternate path, not a promise that a crew can restore the original span instantly.
RPO also needs an engineering owner. Replication may protect configuration and customer data, but it won't restore a failed optical path or replace a damaged power component. Tie each objective to the asset and the recovery mechanism that can meet it.
Map dependencies before ranking risk
Dependency mapping should include:
- Upstream utilities: commercial power, generator fuel, battery systems, cooling water, and building systems.
- Physical access: gates, keys, escorts, permits, road conditions, roof access, and shared corridors.
- External providers: transit carriers, cloud platforms, software vendors, telecom partners, and maintenance contractors.
- Technical relationships: routing, DNS, authentication, monitoring, configuration repositories, and management networks.
- Human capacity: qualified splicers, tower crews, electricians, remote hands, and escalation managers.
A single hurricane surge affecting a data-center transformer yard can interrupt multiple services at once. If a metro aggregation ring feeds that facility, the impact assessment should prioritize the ring, the transformer yard, alternate power arrangements, customer routing, and the restoration sequence as one connected scenario rather than as isolated risks.
The analysis is credible only when operations can challenge it. Ask the splice lead whether the listed restoration time allows for travel and site access. Ask the facilities team whether the alternate power path can support the actual load. Ask the NOC whether the documented reroute has been executed recently. Those answers turn a static register into an engineering decision tool.
Redundancy Architectures for Fiber, Wireless, and Data Centers
Redundancy should be evaluated across the service chain, not one layer at a time. A diverse fiber route is of limited value if both routes terminate in the same building entrance. A second data-center power module doesn't solve a shared fuel or cooling dependency. A wireless backup link may exist on paper but fail to support the same traffic class or recovery objective as the backbone path.
Fiber and wireless choices
For fiber, geographic diversity is stronger than route-label diversity. A ring can provide fast rerouting, but its protection may still depend on shared conduit, bridges, manholes, utility corridors, or a single vendor's equipment. Two physically independent paths usually cost more to survey, permit, build, and maintain, but they reduce common-cause exposure.
Wireless networks have a different trade-off. Overlapping macro sites can preserve coverage when one site fails, while microwave backhaul can provide an alternate path for selected traffic. Satellite or cellular failover may support management access or limited service, but operators should verify latency, capacity, weather exposure, authentication, and power requirements before assigning it a backbone-grade role.
Small-cell backhaul deserves its own assessment. A backup that protects a local access node may not meet the recovery needs of an aggregation or core service. Define the traffic priority before deciding that any available link qualifies as continuity capacity.
Data-center design decisions
Data-center operators typically weigh N+1 against 2N power and cooling arrangements. N+1 can provide useful component-level resilience at lower cost, but a common switchboard, control system, fuel source, or maintenance error can still affect both the active and spare capacity. 2N offers greater separation, though it adds capital cost, space, operating complexity, and testing requirements.
For geographically separated facilities, active-active designs can provide rapid service continuity, but synchronization, quorum, routing convergence, and split-brain behavior must be proven. Active-passive designs may be simpler to operate and troubleshoot, but they place more pressure on the cutover procedure and the standby environment.
Engineering rule: Don't call a path redundant until you've mapped its route, termination, power source, vendor, control plane, and restoration process.
| Architecture Option | Infrastructure Layer | Relative Cost | Recovery Speed | Common-Cause Failure Risk |
|---|---|---|---|---|
| Shared-conduit ring | Fiber | Lower | Fast for eligible failures | High where physical assets are shared |
| Geographically diverse paths | Fiber | Higher | Fast when traffic steering is ready | Lower, subject to shared endpoints |
| Overlapping macro sites | Wireless | Moderate to high | Fast for coverage continuity | Dependent on shared power and backhaul |
| Microwave or satellite fallback | Wireless | Varies | Fast for prioritized traffic | Capacity, weather, and power exposure |
| N+1 power and cooling | Data center | Moderate | Fast for component failures | Shared systems remain material risks |
| 2N power and cooling | Data center | High | Fast when tested | Lower, but configuration errors remain possible |
| Active-passive facilities | Data center | Moderate to high | Dependent on cutover | Standby drift and activation errors |
| Active-active facilities | Data center | High | Potentially fast | Synchronization and split-brain risks |
A continuity plan should also state what happens when data is damaged rather than merely unavailable. Predefine escalation to trusted data recovery specialists when storage integrity, corruption, or failed media becomes part of the incident. That service belongs in the dependency plan before an outage, not in a frantic search after one.
SOPs, Incident Response, and Vendor Continuity
A policy describes intent. A standard operating procedure tells a midnight NOC operator what to do next. For telecom and data-center teams, the useful unit of documentation is the hand-off, including the information one team must provide before another team can act.
Write runbooks for the person holding the pager
Organize SOPs by action and infrastructure layer:
- Alarm handling: confirm the event, correlate related alarms, suppress noise, and open the incident record.
- Fault isolation: compare optical readings, power telemetry, route status, environmental alarms, and recent maintenance.
- Traffic rerouting: identify approved alternate paths, validate routing policy, and watch for congestion or asymmetric behavior.
- Power transfer: define authorization, switching sequence, safety checks, load validation, and rollback.
- Customer notification: specify the trigger, audience, approval path, update interval, and restoration language.
Each runbook needs an owner, prerequisites, decision points, rollback instructions, and escalation contacts. Screenshots help, but they shouldn't replace current diagrams, access instructions, or verified credentials.
Set severity levels around consequences rather than alarm volume. A single customer circuit may need a different response from a core failure affecting many services, even if the monitoring platform generates fewer alerts for the first event.
| Severity | Example Trigger | Acknowledge Within | Lead Team | Escalation Path |
|---|---|---|---|---|
| Critical | Core, facility, or major route failure affecting essential services | Defined by the operator's approved SLA | Incident commander with NOC and facilities leads | Executive duty manager, carriers, vendors, customer communications |
| High | Redundant component failure with remaining capacity at risk | Defined by the operator's approved SLA | NOC or facilities operations | Network engineering, field operations, affected supplier |
| Moderate | Localized service degradation with a viable alternate path | Defined by the operator's approved SLA | NOC or service operations | Network owner and maintenance provider |
| Low | Alarm or defect without current customer impact | Defined by the operator's approved SLA | Responsible technical team | Planned maintenance and problem management |
Put suppliers inside the recovery design
Third-party dependencies often determine whether the plan works. Map fuel suppliers, hardware RMA channels, building owners, reciprocal interconnects, neighboring carriers, tower contractors, cloud providers, and upstream transit providers. A vendor outage can affect several service layers at once, especially when the same supplier provides transport, monitoring, access, or authentication.
Contracts should address emergency mobilization, after-hours contacts, access obligations, spare-part availability, replacement lead times, maintenance notification, incident communications, subcontractor controls, data access, recovery participation, and evidence from tests. Pre-negotiated master service orders prevent a 3 a.m. fiber cut from waiting on procurement approval.
For teams formalizing their broader response model, these SMB cybersecurity procedures from Technovation LLC offer useful structure for roles, escalation, and response documentation. Infrastructure operators should adapt that structure to include field safety, switching authority, carrier coordination, and physical restoration.
Testing Regimes That Prove the Plan Works
ISO 22301-style programs treat exercises as a control, not a calendar exercise. Guidance summarized by URM Consulting's ISO 22301 overview emphasizes that exercises should be deliberately stretching and should provide objective assurance that arrangements will work when needed.
Match the test to the failure you need to expose
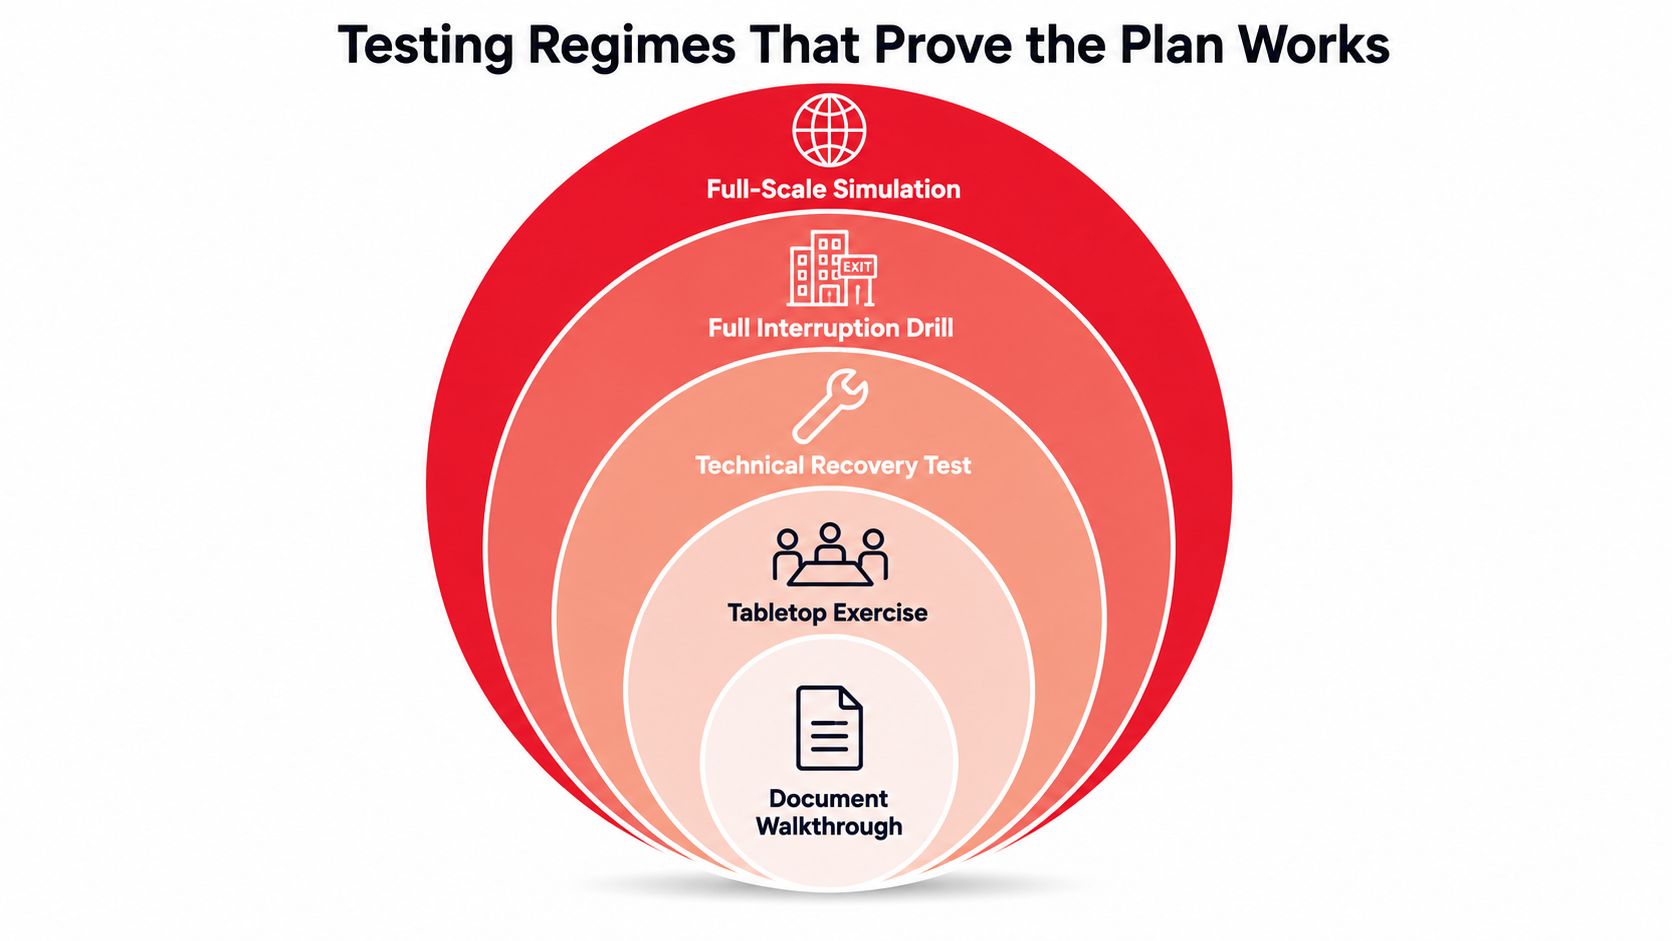
A document walkthrough checks whether the plan contains current contacts, diagrams, permissions, and decision criteria. It won't prove that a router converges, a generator accepts load, or a splicing crew can reach the site.
A tabletop exercise puts the NOC, facilities, security, customer care, vendors, and leadership around the same scenario. It exposes unclear authority, missing contacts, contradictory priorities, and communication gaps without putting live service at risk.
A component failover drill validates a defined technical action. Examples include transferring a power load, failing an optical module, withdrawing a route, promoting a standby system, or restoring from a known backup. These tests catch firmware behavior, BGP policy errors, synchronization problems, and power-transfer defects that a tabletop can't reveal.
Partial live cutovers introduce real dependencies while limiting the blast radius. They can test upstream transit, DNS behavior, monitoring, customer notification, and capacity under controlled conditions. Full-site failover is the most demanding level, particularly for active-active designs where synchronization and split-brain controls must perform together.
Build a repeatable exercise cycle
A practical cadence for a carrier or data-center operator includes:
- Quarterly tabletop exercises: rotate scenarios such as a fiber cut, transformer failure, cloud dependency outage, or loss of building access.
- Semi-annual component failover drills: test power, routing, storage, cooling, monitoring, and selected physical recovery actions.
- Annual full-site exercises: validate the complete activation, traffic movement, staffing model, customer communications, and return-to-normal process.
Bring third parties into the exercise where their action is part of the recovery chain. Peering partners, transit providers, colocation operators, fuel suppliers, and maintenance contractors shouldn't appear only in the final incident call.
Surprise drills provide a more realistic view of readiness, but they need executive sponsorship and clear safety boundaries. Operators can start with limited-scope surprises, such as an unannounced contact verification or a controlled route withdrawal, before attempting a broader interruption.
Every test should produce findings with an owner, priority, due date, evidence requirement, and closure status. A successful test isn't one with no findings. It's one that reveals weaknesses early and drives them to closure.
Documentation, KPIs, and a Living Continuity Program
A plan stored in SharePoint can still be operationally absent. The difference is ownership, currency, and whether the documents guide decisions during degraded access, incomplete information, and competing priorities.
Create a document hierarchy with accountable owners
Keep the hierarchy simple enough to maintain:
- Continuity policy: leadership's scope, authority, objectives, and commitment.
- Program plan: governance, activation, roles, training, exercise, and review processes.
- Business impact analysis: critical services, dependencies, RTO, RPO, and maximum tolerable outage.
- Risk register: threats, vulnerabilities, existing controls, treatment actions, and acceptance decisions.
- Runbooks: technical and field procedures for alarm handling, isolation, rerouting, power, access, and communications.
- Test logs and after-action reviews: exercise evidence, findings, owners, and closure records.
Each artifact needs one accountable maintainer. A shared folder with several editors creates ambiguity, especially after a reorganization, network change, or vendor transition. Use version control, change approval, review dates, and an offline or out-of-band access method for situations where normal identity or collaboration platforms are unavailable.
Measure performance, not document volume
Useful continuity KPIs include:
- Mean time to detect, separated by service and event type.
- Mean time to isolate, including the point when the fault domain becomes clear.
- Mean time to recover, measured against the approved service objective.
- Runbook exercise coverage, showing which procedures were exercised during the review period.
- Recovery time variance, comparing actual performance with the target RTO.
- Post-incident review completion, including whether corrective actions reached closure.
These measures belong in a quarterly business review with executive sponsorship. Continuity funding competes with capacity, expansion, modernization, and revenue projects, so leaders need a clear view of which investment reduces the most credible operational risk.
A continuity KPI is useful only when a team can explain what changed after it moved.
A mature program updates its artifacts after every material incident, test, network change, facility change, or supplier disruption. The maturity path usually moves from reactive response, to repeatable documented practice, to measured and integrated operations, and finally to optimized resilience. Certification can support that progression, but it doesn't replace evidence that technicians, vendors, and systems perform together.
The standard's history reinforces this point. ISO 22301 was first published in 2012 and updated in 2019, formalizing continuity as an integrated management discipline rather than an IT-only disaster response, as summarized in the ISO 22301 history reference. The value comes from applying that structure to real infrastructure.
Practical Next Steps and Common Pitfalls
A carrier or data-center operator can turn a broad continuity ambition into a focused 90-day program without waiting for a complete enterprise transformation. Start with ownership and evidence, then fund the fixes that reduce the greatest recovery risk.
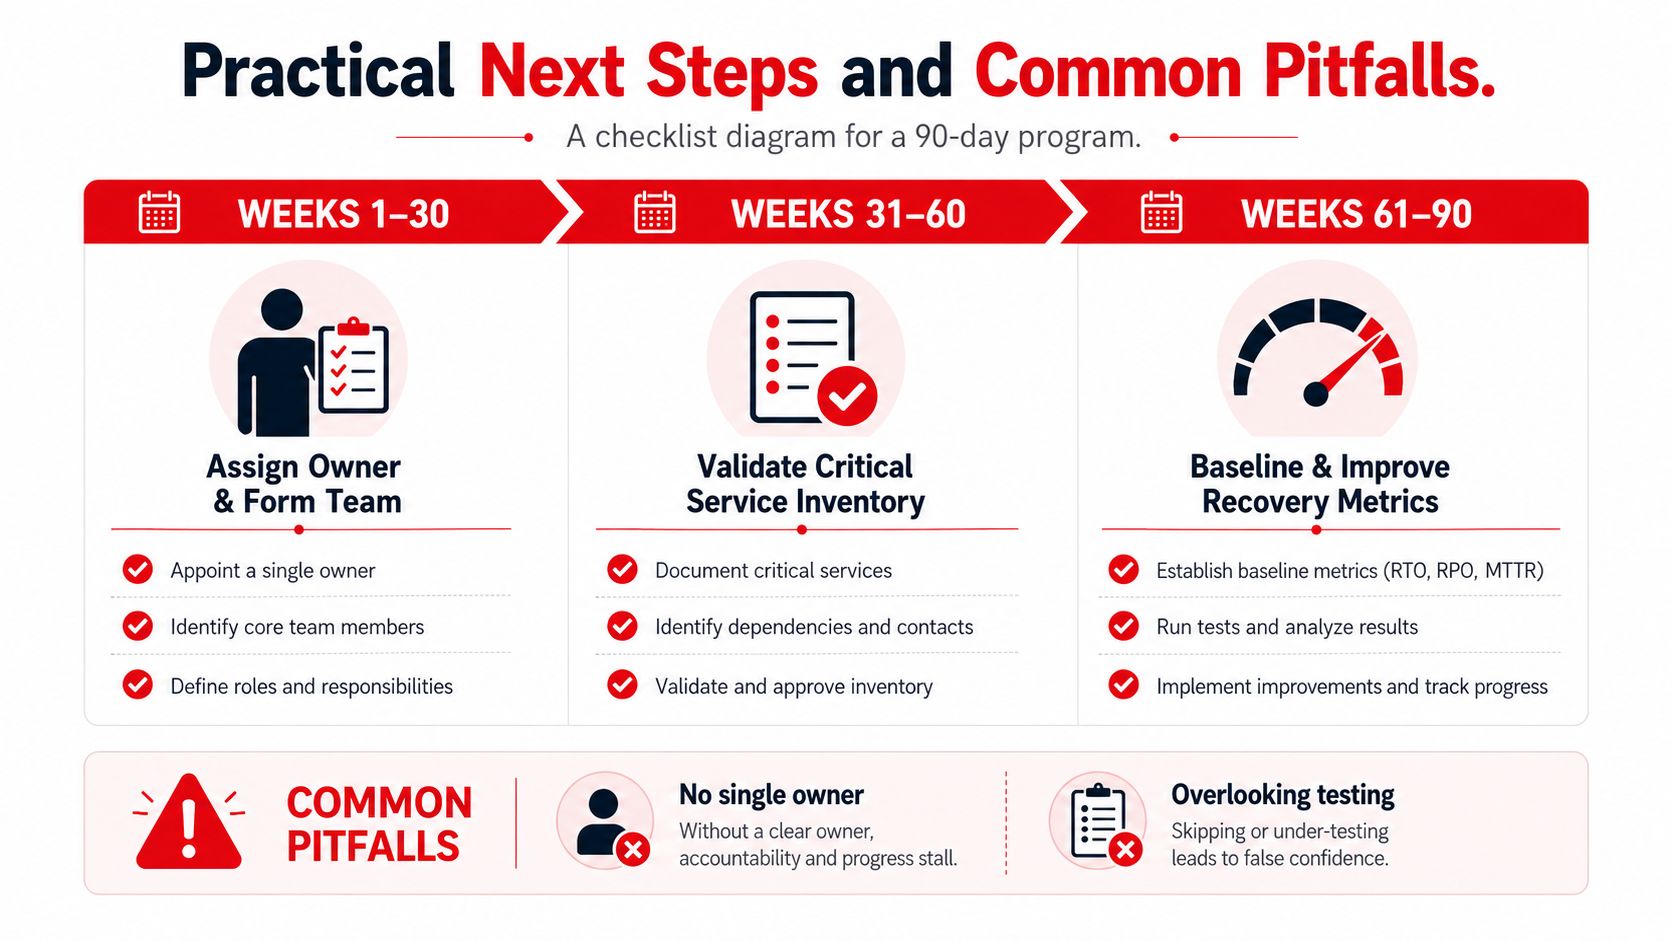
First phase, establish the operating baseline
Assign one accountable continuity owner and form a working group that includes the NOC, network engineering, field operations, facilities, security, customer care, procurement, and key suppliers. Confirm the critical-service inventory at the asset level, map dependencies, identify single points of failure, set service-specific RTO and RPO targets, and record current recovery performance.
Prioritize low-cost corrections early. Update contact lists, correct route maps, confirm access procedures, stage critical spares, verify out-of-band communications, and document who can authorize emergency work. These changes often remove friction before the operator commits to major architecture upgrades.
Second phase, close the gaps that matter
Use the risk register to drive remediation rather than selecting a preferred architecture first. Negotiate emergency vendor terms, maintenance contingencies, fuel arrangements, hardware replacement paths, mutual-aid options, and reciprocal interconnect support. Update runbooks with real commands, approvals, safety controls, rollback steps, and evidence requirements, then train the responders who will execute them.
Third phase, exercise and schedule deeper validation
Run a tabletop exercise, assign every finding to an owner, and track corrective work to closure. Schedule component failover tests for routing, power, storage, cooling, monitoring, or physical restoration, followed by a larger site-level test when the technical and safety prerequisites are ready.
Common early mistakes include:
- Documenting without rehearsing: A complete diagram doesn't validate a field hand-off.
- Assuming carrier diversity equals route diversity: Separate contracts may still use the same conduit or structure.
- Trusting an untested alternate site: Standby capacity can drift, lose access, or lack current configurations.
- Overstating spare capacity: A backup link or generator may not support the priority load.
- Ignoring physical dependencies: Fuel, power, cooling, transport, building access, and permits can stop recovery.
- Treating exercises as pass-or-fail events: Findings are valuable when owners close them and retest the fix.
- Leaving suppliers outside the plan: A provider outage can affect several layers simultaneously.
Review the program quarterly and after every material outage, network change, or supplier disruption. If the plan can't identify who acts, what they need, which dependency may fail next, and how success will be verified, it isn't ready for the next incident.
Southern Tier Resources helps carriers, ISPs, wireless operators, and data-center teams turn continuity requirements into dependable physical infrastructure through fiber engineering, construction, splicing, testing, wireless deployment, and data-center fit-outs. Visit Southern Tier Resources to discuss a practical continuity-focused infrastructure program with a partner that supports design, deployment, maintenance, and 24/7 mobilization.